Message from the President

Dear Friends and Colleagues,

Zachary Reichenbach

The past eighteen months have presented all of us with a variety of challenges and obstacles. Our thoughts are with those who have been, and those who continue to be, affected by the COVID-19 pandemic. My fellow board members and I wish you and your families well.

For many, including me personally, the pandemic has reminded us of what is truly important. Silver linings include less work-related travel and more time with my wife and two daughters, a more consistent schedule allowing for a regular exercise routine and, yes, the occasional Netflix binge. I hope you, too, have been able to find some positives in an otherwise challenging time.

Here at CFA Society Baltimore, we executed on virtual programming to continue to deliver member value. While we missed seeing everyone at The Center Club, virtual event turnout on average exceeded our historical in-person numbers. As we begin to return to in-person events with our membership and the broader Baltimore community, we will continue to offer options for those who prefer to join us virtually.

This year’s Baltimore Business Review is the 13th edition and a continued hallmark of the society. We could not be prouder to partner with the Towson College of Business and Economics to deliver this publication again in 2022.

Many thanks are owed to Executive Director Robyn Osten for her tireless efforts and organization of all the society does, including this publication. Our editorial staff of Susan Weiner, alongside Qing Yan and Rachel Gordon from Towson University, collectively make this publication best-in-class. The design and detail orientation of Rick Pallansch and Chris Komisar from the Towson University Creative Services team is critical to bringing this project to life. Finally, thank you to all our authors and contributors. Your collective time and effort make this possible.

The CFA Society Baltimore originated in 1948 and serves over 750 members today. In a joint effort, the CFA Society Baltimore and its parent, the CFA Institute, work to promote and advocate the principles of the CFA program. The society proudly leads the investment community and other finance related communities by promoting the highest standard of ethics, education, and professional excellence for the entire community’s benefit. In this publication, you can see the list of the top 10 employers of our society’s members.

I hope you enjoy this 13th edition of the Baltimore Business Review.

Dave Donahoo, CFA
President, CFA Society Baltimore

Message from the Dean

Dear Colleagues and Friends,

Dean KaynamaI am proud to introduce the thirteenth issue of the Baltimore Business Review: A Maryland Journal. Every year the Baltimore Business Review presents a collaboration that showcases the strengths of the College of Business and Economics (CBE) at Towson University and the Baltimore CFA Society, creating a wonderful publication that highlights the Maryland business community and beyond.

Building on last year’s issue and continuing to support our vision, this edition of the Baltimore Business Review discusses several different topics that encompass the perspectives of scholars, students, and practitioners. Each brings their own unique voice to discuss relevant issues.

In this issue, two articles illustrate the ways that Maryland businesses have coped with the COVID-19 pandemic, specifically exploring how entrepreneurs have been able to be fluid and adapt within the Greater Baltimore area and how PPP loans have been distributed from banks to different businesses in the counties across Maryland to help facilitate business development in these unchartered times. Further, this issue presents two collaborative works between faculty and students. First, we present a discussion about how the training of poll workers in the Maryland election system provided a model to help reduce cyber, physical, and insider threats to an organization’s data and security. Second, an article examines how increased gender diversity on corporate boards has a positive financial impact for a firm’s shareholders and presents implications for diversity and inclusion in the corporate board room. Finally, we present a survey from the student-run Towson University Investment Group that evaluates the knowledge of our students on investment decision making and risk management.

I would like to express my appreciation to everyone that contributed to this issue of the Baltimore Business Review. It is their time and effort that made  this publication possible. We are delighted that you are joining us as readers, and as always, we look forward to hearing any feedback.

Best regards,
Shohreh Kaynama's signature
Shohreh A. Kaynama, Ph.D.
Dean, College of Business and Economics

Towson University Students post-pandemic outlook on Investing

Milan Pandey
President of TUIG, Majoring in Finance

Aleksandr Olshansky
Portfolio Manager of TUIG, Majoring in Finance

Jordan Le
Director of Communications of TUIG, Majoring in Accounting and Finance

Daniel Morales
Assistant Portfolio Manager of TUIG, Majoring in Finance

Nicholas Norman
Majoring in Finance

Introduction

The Towson University Investment Group (TUIG) surveyed the extent to which Towson University students know about investing and decision making. We started our survey with gathering data from our target demographic audience about general investing knowledge, followed by investment decisions and risk tolerance. In total, we had 38 respondents. We sought to evaluate students’ knowledge of investment decisions, risk management, time-horizon, and used major and college- specific segmentation of respondents to segment our data. With the existing macroeconomic backdrop currently stands – new investing precedents, an influx in new investors, and new economic boundaries, the survey gave us good insight into how college students are proceeding with their decision-making. Key questions in the survey included: What are your financial priorities after graduation? With $100,000 to invest, how would you allocate your money? What percentage of your portfolio would you allocate to cash? If you were to invest in equities, what sectors would you focus on?

Towson University is composed of the following colleges: College of Business & Economics (CBE), College of Health Professions (CHP), Jess & Mildred Fisher College of Science & Mathematics (FCSM), College of Liberal Arts (CLA), College of Fine Arts & Communication (COFAC), and College of Education (COE).We questioned the students throughout the entire University to involve a variety of answers and conducted the survey in October 2021. The results helped us conclude how Towson University students approach investing with respect to their asset allocation, sector and stock diversification along with their specific risk tolerance and time horizon.

Participant Background

The demographics data from our respondents indicate that 67.6% are male. In terms of ethnic distribution, 56.8% of the respondents were White, 16.2% were Hispanic or Latino, 10.8% for Black or African American, 10.8% for Asian/Pacific Islander, and the remainder being distributed between Middle Eastern and Asian and Black. Again, we saw a more significant skew towards Juniors and Seniors, with 43.2% Juniors and 27% Seniors. As for respondents’ employment, 48.6% are employed for wages either salaried or paid by the hour, 21.6% do not actively work, 10.8% are interning, and 10.8% are out of work but looking for a job. A majority of the survey participants were from the College of Business & Economics, consisting of 22 students from the CBE college, with a majority pursuing a Finance Major. The average GPA for respondents was 3.32, with a range between 2.1 and 3.9.

$100,000 Student Portfolio

TUIG conducted a research survey that asked participating students how they would allocate their money if they had $100,000 and what percentage of their portfolio would you allocate to cash, the time horizon, investment objective, and your risk tolerance. The survey also asked what specific stocks, crypto, and sectors students would invest in. Roughly 75% of student respondents said they would diversify their portfolio into various sectors. This approach aligns with the TUIG portfolio as we aim to allocate in all 11 sectors like the S&P 500 index. The remainder of the students would allocate their money into Growth and Real Estate.

Regarding the cash position within their portfolio, 50% of students would allocate 10-25% to cash, 25% said they would allocate 0-10% cash, and 22.2% of students said they would allocate 25-50% of the cash. Overall, students are more likely to keep a more significant cash position (10-25%) than the TUIG portfolio of 8% due to the high fluctuations in the market and the increase in volatility of asset prices. Students’ responses have shown they are more concerned with long-term investing than short-term; 45.7% of respondents said their time horizon is more than ten years, and 28.6% with a 2-5 year time horizon. This aligns with their overall investment objective of growth (75% of respondents), and 19.4% wanted a source of income. Low-risk and medium risk responses both pulled in 46.2%, with 7.7% voting for high-risk. Students aim for growth in their portfolio, have a long-term horizon, and lower their risk by diversifying in different sectors within the market.

Figure 1Figures 2 and 3

Major Holdings

The top 5 holdings from the 2021 survey are Tesla and the S&P 500 ETF ($SPY), coming in with 50% of the participants selecting these stocks, Amazon (55.3%), Microsoft (57.9%), and Apple (84.2%). The most significant differences within the top 5 holdings from this year and last year 2020 would be the absence of Google and Disney and the addition of Tesla and the S&P 500 ETF. This could be because 46.2% of the respondents indicated that they have a lower risk tolerance, and one of the best ways to mitigate risk is by diversifying their money in the S&P 500 ETF. Tesla has also become a new favorite among investors, especially with its recent performance in the stock market and future outlook. Over the past year (October 25, 2020 – October 25, 2021), Tesla has gone up 143.85% from $420.28 to $1024.86 compared to Apple, which has gone up only 29.23% from $115.05 to $148.67, and Disney, which has seen a 38.30% from $124.06 to $171.57.

Cryptocurrency In recent years, cryptocurrency has gained popularity within the investment community as a potential area for profit. Bitcoin, the top cryptocurrency, hit a record high of $66,974 on October 20, 2021, thus moving the rest of the crypto market higher because most cryptocurrencies follow the same patterns as Bitcoin. In this year’s survey, we asked the respondents, “if they were to choose to invest in crypto currency, please specify which crypto currency you would invest in?” and the top 5 responses were Bitcoin (52.8%), Ethereum (44.4%), None (41.7%), Cardano (8.3%), and Dogecoin (8.3%). Many investors do not understand cryptocurrency and do not see it as a possible investment. 41.7% of respondents claim they would stick to equities and other investments that they understand better. This could be one of the reasons for such a high response rate to not investing in crypto at all. Those who understand crypto tend to lean on the more prominent cryptocurrencies like Bitcoin and Ethereum, as they are usually the movers of the crypto market.

Many students are risk-averse and chose no investment in crypto in order to preserve capital and have an adequate annual return for their investments given their longer term horizon. The top picks for specific stock holdings are blue-chips and in the S&P 500, which have a historic performance of 10% annually.

Sectors

During 2020 with COVID-19 and the supply chain crisis, many sectors suffered. The Consumer Cyclical sector (Auto Manufacturer, restaurants) was suffering amid the global quarantine. Many people saved money throughout the 2020 recession, and many companies in this industry lost revenue. Another industry that took heavy battering was the Industrial sector (Airline industry). Following the quarantine and foreign and domestic travel restrictions, the Airline Industry stocks saw severe decreases. In February 2020, shares of Delta Air Lines were worth $58.90; In March, shares dropped to $21.35. Investors suffered significant losses, and many investors transitioned to long-term investing.

Following the 2020 market crash, the method of investing changed for many. When Towson University students were asked, “When investing in the stock market, which sectors interest you the most?” We surveyed that most hypothetical investments were dominated by the information technology (75%) and communication services (44.4%) sectors. With information technology being one of the fastest-growing industries and most essential assets in most businesses, many investors are attracted to the potential growth/innovation and low volatility the future holds. During COVID-19, technology saw a benefit from the pandemic. According to Morningstar, “the US Technology index was up 47.5% in 2020.” Many technology investors gained profits through hardship. This sparked interest for many investors. Communication also received significant increases due to the quarantine and heavy reliance on advertising demand on these platforms. Companies such as Facebook and Google did not suffer during COVID-19 compared to others. In conclusion, it can be observed that Towson University students prefer investing in IT and Communication because of the long-term potential in both sectors.

Student Investing Experience and Knowledge

Of our samples, a simple question was asked: do you invest your money? A surprising 60.52% of respondents say they do, while the remaining 34.21% do not, and the last 5.26% possibly support. It indicates that more than half of the respondents are on the right track to retire in the future; starting at an early age puts them ahead of the curve. When asked about their investment experience from no investment experience to expert knowledge, 44.73% are intermediate, 34.21% are beginners, and 21.05% have no experience. Indicating that most participants have an idea of what they are doing and that they are responsible with their money, one can invest money anywhere, but if no knowledge is known about a particular field, losses can occur; this is why many people seek professional guidance, to achieve their financial and personal goals. When asked if they would seek a financial advisor, 42.10% were not sure, 36.84% would not, and the rest of the participants, 21.05%, would. That is a small percentage that would seek professional advice, which means most of the respondents are pretty confident in reaching their financial goals in life. While confidence is essential in life, there is also a tendency for people to overestimate their abilities, which is very common. To avoid such biases, investors must do their due diligence, in which case research and proper preparations must be done.

Sources

https://www.morningstar.com/articles/1026616/these-sectors-performed-best-and-worst-in-the-pandemic

PPP Loans in Maryland

Michaël Dewally, Ph.D.
Professor in the Department of Finance at Towson University

Yingying Shao, Ph.D., CFA
Professor in the Department of Finance at Towson University

The Program

The COVID-19 pandemic disrupted our daily lives and interrupted business to such a large scale that many enterprises faced imminent failure. To protect the fabric of the American business landscape, the U.S. Congress swiftly passed the Coronavirus Aid, Relief, and Economic Security Act (CARES Act) on March 27, 2020. Among its provisions, the CARES Act allocated $953 billion to the Paycheck Protection Program (PPP). The PPP’s purpose was to fund payroll costs for small businesses as well as interest on mortgages, rent, and utilities. Eligible businesses applied for the loans to private lenders. PPP loans have a provision of forgiveness for the amount of the loan spent on payroll to the extent that employees were kept or rehired. For issuing banks, the financial risks are minimal. The loans are forgivable and the sponsor is the Small Business Administration (SBA), an entity with which banks routinely work in assisting local enterprises. Additionally, the Office of the Comptroller of the Currency (OCC), the Board of Governors of the Federal Reserve System and the Federal Deposit Insurance Corporation (FDIC) recognized that PPP loans have no impact on regulatory capital because they bear no credit or market risks due to the government guarantees. PPP loans therefore only carry operational costs since they require additional loan officers to process applications, speed up lending and deal with exposure to new clients. This was an unprecedented effort.

The program proved swiftly successful. Businesses of all sizes applied for funding and some applied for a second draw for additional funding. The loans carry a one percent interest rate. As of the PPP Report through 9/12/2021, the program approved 11,496,362 loans nationwide for a total dollar amount of $792,753,837,209 funneled through 5,467 lenders. As the economy has recovered albeit at a slow pace, many businesses have initiated their application for forgiveness. The 6,739,872 applications for forgiveness represent 69.3% of the dollar borrowed and the SBA has approved 96.5% of these applications.

The Program in Maryland

COVID-19 Impact
To measure where PPP loans were disbursed in Maryland, we retrieve information on several aspects of the COVID- 19 crisis. We collect data from Google, the Maryland Department of Labor and the SBA. From Google we collect information on Mobility1 during the crisis, starting from the second quarter of 2020. Google’s Community Mobility Report tracks how communities are moving around differently due to COVID-19. Due to different local responses to the crisis, the local interruption of business and economic activity varied across the nation and within states. Google’s Mobility measures tracked “movement trends over time by geography across different categories of places such as retail and recreation, groceries and pharmacies, parks, transit stations, workplaces, and residential.”

We select the Workplace mobility measure to represent how strict or loose the lockdown restrictions were at the local level and how these rules were followed. In Maryland, workplace mobility dropped an average of 29%, in line with the nationwide average. However, some areas saw drops in excess of 40% in Howard and Montgomery counties, and both Baltimore City and Baltimore County experienced drops of about 33%. In contrast, workplace mobility dropped the least in Worcester County with a decline of only 13%. We present these measures in Table 1. We see that the most affected areas are located in the Baltimore – Washington DC corridor while the counties most East and West were the least affected. These same counties experienced the lowest reported cases of COVID-19.

Table 1

Declines in workplace mobility, however, combine the influences of both decreased employment and the ability to work remotely, the latter of which provides job security and protects employment during the pandemic. To know where unemployment spiked during the crisis, we collect unemployment rates across the state from the Maryland Department of Labor. We find that the unemployment rate was the highest in Worcester County (11.1%) followed by Baltimore City (8.9%) and Prince George’s (8.5%) while St. Mary’s County experienced the lowest unemployment rate (4.9%).

PPP Location
Using the data from the SBA from August 2020, we track the first round of the PPP for funds that hit the coffers of Maryland businesses at the height of the crisis.

At the top of the list comes Montgomery county with $2.5 billion, followed by Baltimore City with $2.0 billion, Anne Arundel with $1.3 billion and Prince George’s with $1.20 billion. In contrast, Kent County businesses only received $8 million from the program. We transform the information to show the percentage of PPP loans received in each county. Businesses in Montgomery County received 24.5% of all PPP dollars in Maryland, while businesses in Kent County received the least at 0.1%.

The evidence presented suggests that the distribution of PPP funds reconciled with the intention of the government initiatives. It was in those areas the most impacted by COVID-19 and the ensuing restrictions that PPP lending was the most in demand. The injection of rescuing funds no doubt have helped local businesses sustain their employment and provided financial securities to the workforce.

PPP Recipients
The SBA data is released in two sets: one for small loans under $150,000 and one for large loans in excess of $150,000 up to the limit of $10 million set by the program. The total amount a business can request cannot exceed 2.5 times the average monthly payroll costs for 2019.

In Maryland, under the $150,000 loan threshold, there were 168,981 loans approved for businesses that reported an average of 4 employees. This amounted to $4.8 billion in total loans and 664,764 jobs sustained by the program. There were also 18,918 large loans each exceeding $150,000, representing additional total loans of $10 billion. These larger businesses employed an average of 50 employees, for 944,595 additional employees supported by the program.

PPP Forgiveness
Of this total $14.8 billion, a full $7 billion, or 47%, had already been forgiven by September 2021. The forgiveness rate is larger for larger businesses (51%) than it is for smaller businesses (40%). This difference reflects the burden the early forgiveness application process placed on smaller businesses. The SBA adjusted its forgiveness application to facilitate the sharing of information between the borrower, the lender and the SBA itself.

PPP Lenders
There have been multiple runs of PPP loan issuance since its first launch. As much as the nation saw the entire financial sector participate in the program to help funnel funds where needs were, so did Maryland. The SBA records 768 different nation-wide lenders issuing loans to Maryland businesses, from 1st Choice Credit Union in Atlanta, Georgia to Zions Bank in Salt Lake City, Utah.

Table 2 records the list of the top ten lending banks to smaller businesses in Maryland, providing loans under $150,000, throughout the entire PPP including 2021. The list shows banks ranging far and wide from some of the largest banks in the country (M&T Bank, Bank of America, PNC, and Wells Fargo) to smaller banks active during the PPP rollout. For example, Prestamos, a Community Development Financial Institution (CDFI) out of Arizona and the lending division of Chicanos Por La Causa, a Community Development Corporation (CDC), approved, just in 2021, 494,415 PPP loans for a total $7.7 billion nationwide. In Maryland, Prestamos approved $134 million to small businesses. The only bank locally headquartered in Maryland in the top ten list is Sandy Spring Bank.

Tables 2 and 3

The top ten lenders to larger businesses in Maryland are listed in Table 3. Some institutions appear to carry the same role in actively underwriting the PPP loans. M&T Bank leads their peers again and we see that for all Maryland businesses, M&T Bank issued in total over $2 billion in PPP funding while Sandy Spring Bank provided over $1.1 billion in PPP loans. Research by Li and Strahan (2021)2 shows that, despite their lack of credit risk, banks were more likely to issue PPP loans to businesses with whom they had prior experience, meaning PPP loans were issued to businesses with an established relationship with the issuing bank. Their findings suggest “a new benefit of bank relationships: [..] access [to] government-subsidized lending.” In Table 3, we find more regional lenders and larger loan issuance, compared to the list in Table 2. This is in line with Li and Strahan’s findings on the importance of relationship lending.

Focusing on the largest lenders obfuscates other strong supporters like Harbor Bank, as reported in The Baltimore Sun in August 20213. Harbor Bank opened for business in 1982 and has since raised its assets from $2 million to $321 million in 2020. During the crisis, in Maryland alone, Harbor Bank provided over $46 million in PPP loans, or over 14% of its assets. Harbor issued 426 loans under $150,000 for $13.4 million, and an additional 70 loans over $150,000 for $32.7 million. The Sun article reports that Harbor Bank tasked its “employees [to go] out of their way to help qualified business owners, regardless of whether they were Harbor Bank customers.” Li and Strahan (2021) report that “bank PPP supply [..] alleviates increases in unemployment.” The combined efforts of Harbor Bank, other Maryland lenders and out of state lenders allowed Marylanders to retain their employment during the crisis and prepared Maryland for a speedier recovery.

References

1 https://www.google.com/covid19/mobility/

2 Li, L. and P.E. Strahan (2021). Who supplies PPP Loans (and does it matter)? Banks, relationships and the COVID Crisis. Journal of Financial and Quantitative Analysis Accepted manuscript.

3 A go-to resource during the pandemic – Maryland’s only Black-owned and -managed commercial bank stepped up – Newsmaker, August 3, 2021, Sun, The (Baltimore, MD), Billy Jean Louis, p. 3.

Forecasting the 2022 Midterm Elections and Market Returns Under Different Political Regimes

Nicholas Sheppard, CFA
National Account Manager, T. Rowe Price

The 2020 election results are still fresh in the minds of many Americans, and they continue to be discussed or even contested (as in the Arizona “audit”). Election bills in Texas, Georgia, and other states are debated across the country, with a focus on voter access versus confidence in election results and their integrity. The simple civic duty of voting is now one of the most contentious topics in the country. Despite this, we are edging closer to the 2022 midterm elections, the results of which will likely determine the fate of President Biden.

In the meantime, some states are featuring hotly contested races, such as the Virginia and New Jersey gubernatorial races, in late 2021, as this article went to press. Is there anything we can glean from these very early off-cycle races to potentially predict control of the House of Representatives and Senate in 2022? This article examines three predictors of midterm election results
and market returns under various political regimes: 1) off-year election results, 2) generic ballots, and 3) the presidential approval rating. The results of this midterm cycle will determine control of Congress and potentially Joe Biden’s legacy as our 46th president.

Off-Year Elections in Virginia and New Jersey

Virginia and New Jersey feature off-year elections in 2021 that may have much broader implications for the 2022 midterm elections. In New Jersey, Democratic Governor Phil Murphy remains popular, with percentage approval ratings hovering in the mid-to-high 50s and an average nine-point lead in polls conducted since August 2021. Murphy is attempting to be the first incumbent Democrat in 44 years to be reelected governor of New Jersey.

Virginia faces a slightly more competitive race with Terry McAuliffe, former governor and chairman of the Democratic National Committee, taking on businessman Glenn Youngkin. Youngkin has committed a significant amount of his personal wealth to assist in his fundraising. The FiveThirtyEight.com polling average showed a lead of 3.3% for McAuliffe as of Sept. 30, 2021, but the race had narrowed over the several months since McAuliffe enjoyed a high single-digit lead. Could this race have even more predictive power than others?

Table 1

Here’s what Jim Newell said on Slate.com on September 28:

The Virginia governor’s race has, historically, been one of the easiest races to forecast: The candidate from the party not controlling the White House would win. For 36 years beginning in 1977, the party that had lost the presidential race in the previous year won the governor’s mansion. That streak broke in 2013, when McAuliffe defeated Ken Cuccinelli during Obama’s second term in office, cementing the change in the commonwealth’s perceived political character.1

Election Day 2021 could provide insights into more than just local politics in New Jersey and Virginia. Democratic wins in those states with margins similar to Joe Biden in 2020 would be positive for Democrats. If they win, but by smaller margins, this could signal a rightward shift in the electorate. If they lose either or both races, it will almost certainly be spun as a disaster heading into 2022.

Generic Ballot

The “generic ballot”—a poll question asking whether the respondent would vote for a Democrat or Republican for Congress—has historically been a reliable indicator of midterm election results.

Where do the results stand today? Let’s take a look and dissect what they can mean for the future. As of the first release of FiveThirtyEight.com’s generic ballot polling average in September 2021, the Democrats held a small lead, with Americans preferring Democrats over Republicans, 43.8% to 41.1%.

Figure 1

However, early winning margins for the presidential party have often reversed, as the chart below shows. This leading indicator is not screaming a “red wave” for Republicans. However, if the trend continues, Democrats risk losing the House and potentially the Senate. Tack on the redistricting effort that is likely to benefit Republicans to the tune of as many as 10 seats from gerrymandering alone, and it’s easy to see why some Democrats are beginning to ring the alarm bell.

Presidential Approval Rating

President Biden began January 2021 with strong approval ratings, but has suffered setbacks due to frustration with the ongoing COVID-19 pandemic, inflation (transient or not), the withdrawal from Afghanistan, and immigration issues at the southern border. According to FiveThirtyEight.com’s presidential approval average, President Biden peaked at 55.1% approval in March 2021. As of late September, more Americans disapproved than approved of the job he’s doing as president: 48.8% to 45.3%. In comparison, at this time of the year, President Trump’s approval rating was 38.8% versus more than 52% for President Obama. Both of them experienced historic losses in Congress during their presidency’s first midterm election, which does not bode well for the Democrats.

Market Returns Under Different Political Regimes

The good news for investors? Regardless of the party in charge or the split, the market has performed well under the scenarios shown in the chart below.2 Split control—what some may call “partisan gridlock”—has resulted in the best returns for investors.

What mix of political control was best for stocks? Regardless of who held the White House, stocks performed best when political control of Congress was split, as in Scenario E above. Stocks returned a healthy average of 12.9% per year when the leadership of Congress was split between Democrats and Republicans, which has only happened 16% of the time.

Which Party Will Come Out Ahead?

Since the 1930s, the sitting president’s party has picked up seats in the mid-term elections only three times—including 2002, 1998, and 1934. I do not expect 2022 to buck this trend. The country is deeply polarized, so I do not anticipate a monumental red wave similar to 2010 or 1994. However, early signs point to the Republican party being positioned to capitalize at least marginally on the “midterm curse” and take back control of the House. The Senate is more complicated because Republicans face several retirements and find themselves defending more seats in this cycle.

References

1 Jim Newell, “Uh, Maybe Democrats Should Start Paying Attention to the Virginia Governor’s Race,” Slate (Sept. 28, 2021), https://slate.com/news-and-politics/2021/09/virginia-governor-terry-mcauliffe-glennyoungkin.html.

2 Mike Patton, “Stock Performance And The Political Party In Power: An Historical Look At The Past 75 Years” Forbes (Jan. 12, 2021), https://www.forbes.com/sites/mikepatton/2021/01/12/stock-performance-and-the-political-party-in-power-an-historical-lookat-the-past-75-years/?sh=5f11a8ea7a64.

Developing an Entrepreneurial Mindset: A Look into Female Entrepreneurs in the Greater Baltimore Region During COVID-19

R. Gabrielle Swab
Assistant Professor, Towson University, Department of Management

Jan Baum
Director and Professor of Entrepreneurship, Towson University, Department of Management

Lisa V. Byrd
Director of Events and Business Development, Lead Staff, Baltimore Women’s Advisory Board,
Greater Baltimore Committee

Jennifer Stano
Sr. HR Partner, Towson University, Office of Human Resources

In 2020, the COVID-19 pandemic disrupted labor markets
on a global scale, with employers and employees dealing
with the short-term and long-term sudden and often
severe consequences. Many shuffled to adjust to at-home
work environments, while millions of others were less
fortunate, being furloughed or faced with job loss. Subsequent
pandemic-related research and studies focused
on the macro level of national and global economies,
while small business owners, entrepreneurs, and female
entrepreneurs were largely neglected.

While the economic losses from the pandemic were
huge, the pandemic specifically took a toll on the female
workforce, with female job loss totaling 5.4 million
compared to male job loss at 4.4 million (Ewing-Nelson,
2021; Ellingrud & Segel, 2021). While the years of 2020
and 2021 may be over, the pandemic and the significant
financial insecurity many women and their families are
facing are not (Boesch & Phadke, 2021). However, women
and entrepreneurs create an interesting and unique
context of individuals to consider during a time where
both personal and professional changes are happening
rapidly, and without much foresight into the future.
Female small business owner Carla Nelson Chambers,
founder of The Nelson Ideation Group, says, “as women,
we can turn on a dime”, and as “entrepreneurs, we have
to do that anyway.” She further clarified that “Women are
able to make <those> changes very quickly because we
are so used to, as women, figuring out what is the need
for my family, for my friends, for me.” Entrepreneurs
and women alike have a unique mindset in creating
ways to stay viable, whether it be for their business,
or those around them (e.g., Ambepitiya, 2016; Patil &
Deshpande, 2018).

In this regard, a discussion highlighting female entrepreneurs
as a growing and erudite success story deserving
attention in the pandemic conversation. They represent
a group of emerging business leaders that can teach us
as individuals, managers, or leaders survival skills in
these unprecedented times.

To learn the valuable lessons female entrepreneurs have
to offer, our research team partnered with the Greater
Baltimore Committee (GBC) and its Baltimore Women’s
Advisory Board (BWAB). In doing so, we conducted a
survey to investigate the impact of the pandemic on
women in the workplace within the Greater Baltimore
region. We had a final 433 male and female respondents
across a variety of industries and roles that completed a
survey of questions ranging from organizational support,
job satisfaction, stress, to discrimination. If individuals
identified themselves as an entrepreneur, they were
asked additional quantitative questions related to entrepreneurial
identity and persistence, as well as qualitative
questions regarding their business pre, during, and post
pandemic. From the original 433 participants, we had 18
female entrepreneur respondents within the region that
provided our team with both quantitative and qualitative
data. Based on discussions and feedback from our
sample, we have compiled a look into how this group
is pivoting during the pandemic.

The Sample

Within our sample, we found a mix of entrepreneurs who
had been in business over 20 years, down to those who
had started their business within the year prior to the
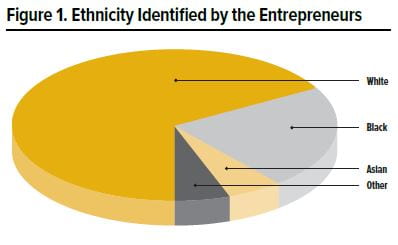
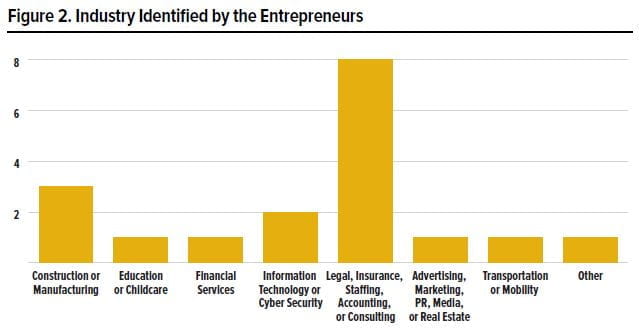
pandemic. Among the 18 female entrepreneurs, there
was one in the 26-35 age group, four in the 36-45 age
group, five between 46-55, five between 56-65, two 65
or older, and one did not disclose their age. The ethnic
diversity of the entrepreneurs is reported in Figure 1,
while the industry in which the sample identified with
is in Figure 2.

Figure 1

Figure 2

Lessons Learned from an Entrepreneurial Mindset

Entrepreneurs tend to have a more proactive personality,
higher resilience, greater self-efficacy, and a more positive
stress mindset, meaning they respond to challenges with
motivation versus defeat (Li et al., 2020; Neneh, 2019).
However, one does not have to be an entrepreneur, nor
possess all of the aforementioned qualities, to develop
an entrepreneurial mindset. Observations based on
their responses provide insight into the mindset and
unique ways entrepreneurs adapt to change and stay
viable during adversity.

(1) Recognize when to Pivot
“We took immediate action in 2020 to be proactive around
safe work practices, such as PPE and a combination of
telework.”

“The business did lose out on revenue due to the stay home
order but I am now currently writing a book.”

Entrepreneurs have an innate ability to recognize an
opportunity (Kirzner 1973) and thus, a question surrounding
entrepreneurship research is why entrepreneurs
recognize opportunities that non-entrepreneurs fail
to see (Dyer, Gregerson, & Christensen, 2008). Popular
explanations for their unique opportunity recognition
may include personality, cognitive, or social network
differences. In turn, these thought processes are linked
to one’s perceptions of risk-taking, tolerance for ambiguity,
or one’s locus of control (meaning one’s view on
whether or not they have the ability to influence a situation)
for example.

With feedback from our sample and with the support of
other entrepreneurial research (Dyer et al., 2008), both
entrepreneurs and organizational leaders recognize
opportunities for innovation by frequently asking questions
that may challenge the status quo. This includes
questions regarding what the future may hold. Second,
entrepreneurs can explore these questions and/or their
environment by creating hypotheses and testing them
along the way. Third, through the engagement of idea
networking, they can test their hypotheses on a network
of individuals with differing perspectives, thus learning
from others as well. Finally, engaging in these processes
leads to pattern recognition and thus, the discovery of
new ideas.

(2) Increase Resilience
“I opted to use <a> business coaching program to stay
connected to more people during the pandemic and
it has been a wonderful thing both for learning online
marketing gaps I knew I needed to fill and in helping to
keep a vibrant tribe.”

“I embarked upon my venture a few weeks prior to COVID.
COVID made things a lot more difficult – specifically,
acquiring financing, and solidifying client retention.
COVID also put an additional strain on family income
because it shut my spouse’s business down for several
months. However, it also gave my business somewhat
of a competitive advantage because our skillset could
manage virtual interpersonal relations better than many
of our competitors.”

Resilience is described as “The capacity of a system
to survive, adapt and grow in the face of change and
uncertainty” (Fiksel, 2006, p. 21). The COVID-19 pandemic
not only disrupted the entire economy, but had a
significant impact on peoples’ personal and professional
lives. It is within this context that the heightened levels
of resilience often found in entrepreneurs (Bullough et
al., 2014) allowed them to shift and reinvent (their businesses)
during this time. For example, regardless of a
positive, negative, or generally significant event – the
interpretation, coping mechanisms, and other individual
differences (e.g., resilience, stress mindset) of an entrepreneur
influences the viability of their venture, and
further, the long-term effects of their business. Events
– such as the pandemic – also determines their view on
needed resources, which largely influences their wellbeing
and start-up persistence (Marshall, Meek, Swab,
& Markin, 2020).

These heightened levels of resilience “maintain relatively
stable, healthy levels of psychological and emotional
functioning over time” (Corner, Singh, & Pavlovich, 2017,
p. 688), though active steps can be taken to increase
resilience. According to psychologist Susan Kobasa,
resilience stems from first, viewing difficulty as a challenge
rather than a paralyzing event, second, staying
committed to your life and goals (this includes work as
well as relationships, spiritual beliefs, etc.), and third,
focusing on those events or situations that you have
control over, which in turn leads to greater empowerment
and confidence.

(3) Learn from the Past to Shine Light on Future Directions
“I have learned that remote work can be positive.”

“I convinced my mom it would be a good idea to close
down our showroom and strictly do online sales from
our warehouse. This was one of the best decisions we’ve
made and have seen a large increase in revenue since
going to strictly online sales.”

Both opportunity recognition and heightened resilience
further allows for a greater ability to learn. Combining
these mindsets and learning from the past increases the
ability to cope with failure (Singh, Corner, & Pavlovich,
2007), along with the emotions and cognitive processing
in which to do so (Byrne & Shepherd, 2015). Entrepreneurs
perceive heightened learning, such as the ability
to transfer knowledge from one venture to the next,
when they first, choose to attribute the failure to internal
causes and second, start a second venture quickly after
failure (Yamakawa & Cardon, 2015). Therefore, reflecting
on past controllable steps, combined with a rapid view
on how to move forward, increases both learning and
a look into ways to move forward.

Final Thoughts

Discussions on the mindset of entrepreneurs may not
initially appear relevant to those in a large organization
or in a corporate role. However, according to a
study led by the Boston Consulting Group, one in three
companies requires a turnaround, at any point in time.
In this regard, organizations, and those entrepreneurs
or leaders, must be frequently prepared for changes
to their operations or strategies. We encourage these
considerations in not only the pandemic, but also during
general organizational change.

References

Ambepitiya, K. R. (2016). The role of women entrepreneurs in establishing
sustainable development in developing nations. World Review
of Business Research, 6(1), 161-178.

Boesch, D., & Phadke, S. (2021). When women lose all the jobs:
Essential actions for a gender-equitable recovery. Center for American
Progress.
https://www.americanprogress.org/issues/women/
reports/2021/02/01/495209/women-lose-jobs-essential-actions-genderequitable-
recovery/

Byrne, O., & Shepherd, D. A. (2015). Different strokes for different
folks: Entrepreneurial narratives of emotion, cognition, and making
sense of business failure. Entrepreneurship
Theory and Practice, 39(2), 375-405.

Corner, P. D., Singh, S., & Pavlovich, K. (2017). Entrepreneurial resilience
and venture failure.
International Small Business Journal, 35(6), 687-708.

Ellingrud, K., & Segal, L.H. (2021). COVID-19 has driven millions of
women out of the workforce. Here’s how to help them come back.
Fortune. https://fortune.com/2021/02/13/covid-19-women-workforceunemployment-
gender-gap-recovery/

Ewing-Nelson, C. (2021). All of the jobs lost in December were
women’s jobs. Washington: National Women’s Law Center. https://nwlc.
org/wp-content/uploads/2021/01/December-Jobs-Day.pdf

Dyer, J. H., Gregersen, H. B., & Christensen, C. (2008). Entrepreneur
behaviors, opportunity recognition, and the origins of innovative
ventures. Strategic Entrepreneurship Journal, 2(4), 317-338.

Fiksel, J. (2006). Sustainability and resilience: toward a systems
approach. Sustainability: Science, Practice and Policy, 2(2), 14-21.

Kirzner, I. M. (1973). Competition and entrepreneurship. Chicago:
University of Chicago Press.

Li, C., Murad, M., Shahzad, F., Khan, M. A. S., Ashraf, S. F., & Dogbe, C.
S. K. (2020).
Entrepreneurial passion to entrepreneurial behavior: Role of
entrepreneurial alertness, entrepreneurial self-efficacy and proactive
personality. Frontiers in Psychology, 11, 1611.

Marshall, D. R., Meek, W. R., Swab, R. G., & Markin, E. (2020). Access
to resources and entrepreneurial well-being: A self-efficacy approach.
Journal of Business Research, 120, 203-212.

Neneh, B. N. (2019). From entrepreneurial intentions to behavior:
The role of anticipated regret and proactive personality. Journal of
Vocational Behavior, 112, 311-324.

Patil, P., & Deshpande, Y. (2018). Women entrepreneurship: a road
ahead. International Journal of Economics, Business, and Entrepreneurship
(IJEBE), 1(1).

Singh, S., Corner, P., & Pavlovich, K. (2007). Coping with entrepreneurial
failure. Journal of Management & Organization, 13(4), 331-344.

Yamakawa, Y., & Cardon, M. S. (2015). Causal ascriptions and perceived
learning fromentrepreneurial failure. Small Business Economics,
44(4), 797-820.

A Review of Agriculture and Conservation in Maryland

Vincent Anderson, CFA
Director, Equity Research, Stifel Financial Corp.

Laura Wood
Agriculture & Outreach Coordinator, ShoreRivers

Despite Maryland’s population growing nearly 30%
since 1990, with accompanying rapid development of
residential areas, agriculture remains an important part
of much of the state’s local economy and culture. Within
Maryland, the economic, cultural, and environmental
impact of farming is perhaps no greater than on the
Eastern Shore. Much of the state and its visitors may
only give a passing glance to the swathes of corn and
soybeans on their way to the iconic Chesapeake Bay
or Atlantic shores. But despite the predominance of
farmland, the Eastern Shore struggles to support its
agricultural heritage amid volatile crop markets and
pressure to protect the health of the Chesapeake Bay
and its watersheds. Luckily, there are organizations
that have risen to the challenge of preserving both the
environment and Maryland’s agriculture.

Global Row Crop Markets: A Historical Perspective

Historically, row crop prices have suffered from the
deflationary impact of technological advancement in
the form of steadily improving yields. Beginning with
the postwar proliferation of chemical fertilizers and
mechanized equipment, yields (crop output per unit of
land area) in the U.S.—and elsewhere in the world—have
largely outpaced demand growth. The result has been
a decoupling of inflation-adjusted crop prices from
traditional “industrial” commodities such as energy
products, non-precious metals, etc. For perspective, the
significant appreciation in energy and metals prices in
response to the China-led commodity super-cycle of
the 2000s contrasts with row crops’ much more muted
response (Figure 1).

Figure 1

Crop prices tend to be less sensitive than industrial
commodities to economic cycles because demand is
more stable, tracking population growth and household
incomes. Given this, higher crop prices typically require a
supply-side push, either from a decline in acreage (capacity)
or yields (utilization). As with any large fixed cost base,
profitability is heavily tied to the utilization of the fixed
asset (land, equipment). So it is unsurprising that global
crop yields have marched steadily higher for decades as
farmers look to maximize the value of their operations
(Figure 2). Knowledge of best practices; advances in farm
machinery, soil testing, and crop monitoring; and new
technologies in crop protection chemicals and seed
genetics have all contributed to increasing output per
acre. The result has been long inventory cycles, which
slowly influence the growth in new acreage.

Figure 2

Maryland’s Agricultural Economy at a Glance

Maryland’s agricultural sector amounted to $2.2 billion—
only 1.3% of the state’s 2018 gross domestic product.
However, the agricultural economy’s health remains
essential to the state’s rural population because 82.6%
of Maryland’s more than 12,000 farm organizations are
individual/family sole proprietorships. Of those, less than
25% generate more than $50,000 per year in revenue
despite nearly 50% of the state’s farm operators listing
agriculture as their principal occupation.

A higher percentage of Maryland’s rural population
fails to complete at least high school (11.7% vs. 9.5%
in urban areas). The rural population also experiences
higher poverty rates (12.3% vs. 9.0% in urban areas) and
a median income 13.4% lower than urban households
and 33.5% lower income per job worked. Compared to
national averages, Maryland’s rural population comes
out slightly ahead in areas such as income and education
disparity. Some of the gap is potentially explained by the
relatively higher population density of the state versus
other rural communities, providing more opportunities
for nonfarm income sources. Additionally, many farms in
Maryland generate nonagricultural income via services
such as hunting rights, horse boarding, etc. However,
the data still underscores the challenges facing one of
the state’s higher-risk demographics.

The composition of Maryland’s agricultural economy is
unique. While row crops are generally its most visible
representation, poultry (particularly chickens) is the state’s
largest source of agricultural revenues (Figure 3). With
Perdue Farms’ strong presence in the area incentivizing
local production, poultry markets have offered a solid
revenue source, diversified from row crops, and with good
local demand. This supplement is important, given the
comparatively low share of Maryland farmland dedicated
to pastureland and high-value livestock/dairy operations.

Figure 3

If farmers across the U.S. have faced economic challenges
from a decade of low crop prices, how have Maryland
farmers fared? Maryland farmers have shown remarkable
resiliency when their average yields for the state’s
primary row crops, corn and soybeans, are compared
to national averages (Figure 4). While naturally a smaller
subset of geography will display greater volatility than
the national average, particularly from weather disruption,
on a whole Maryland has performed well over the
past few decades, averaging just 10% lower yields on
soybeans and 12% lower yields on corn since 1980.

Figure 4

This relatively strong performance has been achieved
despite Maryland farmers operating an average farm
size of just 160 acres versus the national average of
441 acres, greater distance from key supply chains
(mainly the Mississippi and other tributary systems that
connect much of our grain and fertilizer shipping to the
“breadbasket” states). In Maryland, the average farm size
has remained the same since 2007, while average farm
size nationally has increased 5.5% from 2007–2017
(most recent available data). Consolidation has been a
key theme and is important to owner-operated efforts
to increase fixed-cost leverage, particularly on equipment,
as farm rent values (a cost for non-owner operated
farms) have remained stubbornly high despite lower crop
prices. Maryland’s geography—unlike the large open
expanses of the Midwest—has likely contributed to its
more fragmented operations. Moreover, its proximity to
attractive Mid-Atlantic real estate markets has created
competing nonagricultural bids for farmland.

Agriculture and Conservation: A Delicate Balance

Farming is a critical industry, given its role in feeding
the masses. Accordingly, governments worldwide have
worked throughout history to protect their domestic
agriculture through subsidies and direct intervention in
agriculture markets. In fact, so-called “bread riots” have
long been a topic of discussion in political science and
geopolitics, to the extent that rapid food price inflation
has contributed to political upheaval. For example, some
historians estimate that bread as a share of the average
working-class citizen’s daily wages rose over 30% in the
run-up to the French Revolution. More recently, the Arab
Spring uprising coincided with significant increases in
food inflation that the government of Egypt, at the time,
was unwilling to offset with increased subsidies. During
China’s African swine fever outbreak, which led to the
deaths of over 50% of its swine herds, the government
released strategic reserves of pork. This was partly due
to pork’s cultural significance, despite the shortage not
carrying any material nutrition risks to the population.
During the COVID-19 outbreak, global grain traders saw
increased demand for basic agriculture commodities into
areas that rely on imports to meet domestic caloric needs.

Given both lagging farmer incomes and the political
importance of food supplies, efforts to address real concerns
over issues, such as water pollution, can struggle
to gain traction. In some cases, these efforts compete
indirectly with programs that seek to preserve land for
agriculture by buying real estate development rights,
keeping land that may otherwise be uncompetitive in
agricultural production and providing little incentive
for farmers to contribute capital to improve nutrient
management and run-off controls. Partly as a result,
official estimates of farmland in conservation programs,
both in absolute terms and as a share of total farm acres,
has declined, both nationally and in Maryland. However,
nonprofits and corporations within the agriculture value
chain continue to work toward alternative programs to
reduce the environmental impact of farming.

Lessons in Farmer/Conservation Cooperation
in Chesapeake Bay: ShoreRivers Example

The Chesapeake Bay is central to Maryland’s identity
and, for much of the state, its culture. This extends far
inland, owing to the watershed’s 150 major rivers and
streams, totaling over 100,000 tributaries. Surrounding
these tributaries on the Eastern Shore, farmers who have
spent generations working the land and enjoying recreation
on the bay are asked to make difficult decisions.

Runoff is a well-known issue in environmental conservation;
rainfall carries waste and materials intended for land
use into waterways where they become pollutants. Many
are likely familiar with the Gulf of Mexico “dead zone,”
the disruption to Gulf Coast fishing and water quality
from run-off flowing down the Mississippi River. Much
of the Chesapeake’s struggles with water quality in the
main stem of the bay are attributed to run-off from the
Susquehanna River. However, the Eastern Shore community
is also facing the need—and an opportunity—to
improve its waterways and their impact on the health
of the Chesapeake. Organizations like ShoreRivers are
working to educate and assist farmers in balancing
the needs of the land with the needs of the local water
system to address these challenges.

Farming and Conservation: Challenges
Plants are no different from other biological life in
needing specific nutrients to grow and survive. However,
growing crops requires a different timeline for nutrition
than do human beings with their decadeslong lives. With
row crops being planted, grown, and harvested in less
than a calendar year, it is paramount that enough of the
right nutrition is available to the plant at the right time
to maximize yields. After over a decade of lagging crop
prices, making changes to agricultural practices that
serve any purpose other than to get maximum production
out of the land can be difficult for farmers to accept.

On the Eastern Shore, the low-lying land, permeated
throughout with tidal rivers, has often struggled with
run-off of all kinds. The prevalence of agricultural land
use there has placed much of the burden on farmers
to address conservation needs. Convincing farmers
of the crucial role they play in bay restoration can be
difficult. Pollution comes from all sectors, and farmers
can sometimes feel overly burdened with the task of
improving local waterways. However, on the Eastern
Shore, agriculture is the largest land-use sector for all
of the rivers’ watersheds. Therefore, agriculture has an
undeniable impact on local waterways and an undeniable
opportunity to improve water quality. Luckily, given
the close cultural ties the local farming community has
to the bay, and with the consistent efforts and sciencedriven
approach of ShoreRivers, the nonprofit has been
successful in working with agricultural stakeholders
on these issues.

Farming and Conservation: Successes
ShoreRivers works to improve the health of Eastern Shore
waterways through science-based advocacy, restoration,
and education. The organization formed in 2017 via the
merger of the Chester River Association, Midshore Riverkeeper
Conservancy, and Sassafras River Association.

As of May 2021, the organization of roughly two dozen
full-time employees had 186 projects (of which 130 are
agricultural) that have diverted over 144,000 pounds of
nitrogen; 17,500 pounds of phosphorus; and 5,000 tons
of suspended solids (sediment) from the waterways. The
group adapted quickly during the pandemic, growing its
project base by over 40% from May 2019 to May 2021.

The organization relies on extensive testing and standardized
water quality grading methods to foster confidence
in its reporting. The transparency of regularly reporting
successful practices and areas needing improvement
lend credibility to its advocacy. In fact, many of the
organization’s projects are inbound requests. Its extensive
testing and reporting of water quality along the region’s
river system have been pivotal in convincing locals that
most of the local water quality issues originate from
their own land use, rather than as an extension of the
broader water quality conditions of the Chesapeake Bay.

ShoreRivers works to position itself as a partner to the
agricultural community by providing technical support,
such as offering engineering assistance when designing
replacements for old, failing drainage systems to
incorporate better run-off controls, and coordinating
financial assistance, such as state and federal cost-share
programs with grants and foundation funds to complete
comprehensive projects that provide for buffer zones
between crop land and waterways. ShoreRivers and
farm partners are also investigating innovative financing
mechanisms to help fund conservation through
outcome-based approaches to leverage private investment.
Employing this collaborative approach paired
with innovative financing, along with its members’ deep
personal connections to the area, have helped drive its
successes.

Looking Ahead

Farmer fortunes have taken a perhaps unexpected turn
since the outbreak of the COVID-19 pandemic; while
economics globally reeled from the impact of shutdowns,
crop prices have risen markedly. Currently, corn and
soybean prices are up over 40% compared with 2019
levels. Weather issues in Brazil, Eastern Europe, and
China, recent changes to biofuel economics, and the
pandemic’s impact on the purchasing patterns of nations
that rely heavily on imported crops have combined
to push prices to levels not seen in years. For farmer
incomes, this has clearly benefited bottom lines. For
conservation efforts, it may require more adaptation.
Higher farm incomes could increase the opportunity cost
to farmers of placing marginal quality land into conservation
programs, but may also spur farmers to invest in
better run-off control infrastructure. Regardless of the
direction of crop markets, organizations like ShoreRivers
will continue to work to improve the quality of local
water systems while preserving Maryland’s agricultural
industry and heritage.

Securing Organizations from Within: Opportunities and Challenges with Insiders

Natalie M. Scala
Associate Professor & Graduate Program Director, Towson University

Josh Dehlinger
Professor, Towson University

Yeabsira Mezgebe
Research Assistant & Graduate Student, Towson University

Much attention has been paid to cyber, physical, and
insider threats to an organization’s data and security.
Farahani, et al. (2016) in the Baltimore Business Review
identify major cyber breaches of companies and organizations
such as JP Morgan Chase, CareFirst Blue Cross
Blue Shield, eBay, and Home Depot, and propose best
practices to manage cyber risk. Since that article, insiders
with malicious intent have received widespread attention,
including major U.S. Government breaches driven
by Chelsea Manning and Edward Snowden. Insider
threats are related to human behavior and can range
from simple mistakes made by system users to deliberate,
malicious actions. A vast majority of insiders are
altruistic and do not intend harm but may introduce
risk through their mistakes or poor security behaviors.

Traditionally, the approach to managing organizational
insiders—defined by the U.S. Cybersecurity and Infrastructure
Security Agency as anyone who has access to
an organization’s network systems, data, or premises and
also uses that access (CISA, 2021)—has been monitoring,
surveillance, or other forms of supervision of the insiders’
interactions and use of cyber systems. However, a
new trend is emerging, where insider threats, which are
considered a problem driven by users, shifts to a framing
in terms of risk, which is instead driven by data (ARLIS,
2021). Considering insiders as threats is reactive, focusing
on the protection and privacy of an organization’s
data, and is structured around activities such as securing
email, web monitoring, and phishing attacks. However,
considering an organization’s insiders as potential risks,
but not necessarily threats, acknowledges the fact that
a vast majority of insiders are altruistic, shifting the
organization’s thinking to proactive by focusing on prevention
by means of a centralized policy or process. In
proactive insider risk management, the goal is to prevent
data leaks and breaches before they occur, rather than
reacting to what may have already happened.

The two approaches to insiders align with competing
definitions of metrics. In cybersecurity, metrics
are defined as best practices or predictive measures
to manage or mitigate threat; however, in analytics,
metrics are descriptive and focus only on the past and
present (Scala and Goethals, 2020). These definitions
generally align with the proactive/reactive approaches
to managing insiders. The key is to consider the level
of risk that an organization is willing to undertake as
well as the amount they can bear. Levels of risk may
not be consistent across organizations and may vary
by the type/size of firm, operating environment, cyber
maturity, nature or type of data to protect, etc. (Scala
and Goethals, 2020; Black, et al., 2018). Corresponding
metrics to define these polices are tough to develop but
are of great interest in the cybersecurity community.

Behavior Intent as Metrics

Assessing insider behavior intent is one method of defining
a metric for insider risk. The Security Behavior
Intentions Scale (SeBIS), developed by Egelman and
Peer (2015), is a validated inventory (Egelman, Harbach,
and Peer, 2016) that is accepted by the usable security
community to create characterizations based on
the respondents’ level of cyber and computer security
knowledge and savvy. Questions in the SeBIS inventory
focus on attitudes toward choosing passwords, securing
devices, updating protocols, and proactive awareness
(Egelman and Peer, 2015). Participants answer 16 questions
on a five-point Likert scale. The SeBIS inventory
measures participant intentions related to security and
how those intentions may vary between individuals; it
does not measure or predict actual behavior. However,
organizations can interdict on employee intentions with
the goal of poor approaches to security not becoming
actions. The outcomes and actions taken after a SeBIS
assessment of the workforce can empower insiders
to become part of a security solution and not another
source of risk.

Case Study: U.S. Elections Poll Workers

To illustrate the SeBIS inventory, consider poll workers
in U.S. elections. Poll workers are part of the first line of
defense in elections security; as such, they need to be
aware of and vigilant to real-time issues that may occur
and threats that may evolve on Election Day (Scala, et
al., 2020). As elections are primarily one-day events in
the U.S., they cannot be repeated or postponed. Consequently,
the security and integrity of the votes must be
maintained throughout the entire process. Poll workers
need knowledge of voting threats to be empowered to
mitigate and manage issues that may arise. However,
across the U.S., poll workers do not necessarily receive
threat training as part of election preparations.

Poll workers are trusted insiders to the voting process.
They have access to voting systems, which the Department
of Homeland Security classifies as critical infrastructure
(DHS, 2020). This includes paper ballots, electronic
voting cards, and all equipment used to administer an
election. In Maryland, this includes optical scanning
machines, electronic poll books, ballot marking devices,
and provisional voting materials. Furthermore, poll
workers are generally unsupervised while interacting
with equipment and related ballots. Thousands of poll
workers staff an election; Anne Arundel County alone
had over 1,900 poll workers for the 2020 November
General Election (Deville, 2020).

To deploy the SeBIS assessment, a data collection
campaign from June through November 2020 targeted
previous poll workers and/or those with intent to serve in
the 2020 U.S. General Election and yielded 2,213 viable
survey responses from 13 states. The target population
was recruited via email campaigns, social media, and
a postcard mailing; lists of poll workers for the email
campaign and postcard mailing were obtained from
county boards of elections and public records requests.
To our knowledge, this is the largest set of collected
SeBIS data responses of any population. Respondents
were presented the SeBIS survey from Egelman and Peer
(2015) in its entirety. Respondents were also screened to
ensure they previously served as a poll worker or had
intent to serve during the 2020 elections.

Table 1

Table 1 presents the mean and standard deviation for
each SeBIS question response amongst all respondents;
the questions are numbered as they appear in the full
original inventory. Note that SeBIS is scored on a 1-5
Likert Scale, with responses ranging from never (1)
to always (5). Table 1 reflects that many poll workers
reported positive security intentions with their own
personal computing devices. Questions F5, F8, F9,
F10, F11, and F13 are negatively phrased in the SeBIS
inventory, so the response scale was inverted for analysis;
these questions are denoted in bold in Table 1. A
higher mean in Table 1 (closer to 5.00) implies stronger
security behavior intentions amongst the respondents.
It is also important to note that the standard deviations
in Table 1 imply the existence of variability in security
intentions amongst the respondents.

To further investigate the data, a Spearman rank-order
correlation analysis was performed on the entire data
set. Spearman’s rank-order correlation was used to
measure the strength and direction of the association
between respondents’ security intentions. Spearman
rank-order correlation analysis assumes that participants
were randomly selected; the selection of rank
is independent; and the relationship of one rank with
another is monotonic, which is appropriate for this
dataset (Kraska-Miller, 2013).

Table 2

Table 2 presents the Spearman rank-order correlation
and corresponding p-values for the SeBIS inventory
questions. A significant positive correlation implies
that security intent either tends to increase or decrease
in parallel between the pairwise survey questions or
intentions being compared. A significant negative correlation
implies that security intentions tend to move in
opposite directions (i.e., one increases and one decreases)
between the pairwise survey questions.

Implementing Behavior Intent Metrics

A correlation analysis alone does not identify actions to
take or behavior intentions to consider for improving
polling place security and reducing poll worker insider
risk. However, to implement the insights from the correlation
analysis, organizations should partner with
their insiders and have them buy into becoming part of
proactive mitigation solutions. Poll workers are generally
altruistic insiders who are committed to their service;
therefore, empowering them with the means to identify
and mitigate risks and threats that may arise is critical.
This includes building positive feedback loops into
organizational culture that reward, instead of intimidate,
for participation in the organization’s security posture.
Training is also a key component; Scala, et al. (2020)
propose online learning modules for poll workers to
identify and mitigate potential threats that may arise at a
polling place. That training, which was utilized in Anne
Arundel County during the 2020 General Election (Deville,
2020), and statistically significantly increased poll worker
threat awareness (Scala, et al., 2020), can be extended
to include targeted correlated behavior intentions from
the SeBIS inventory. Such improvements will create
more robust insider risk training, directly addressing
potential shortcomings in particular security intentions.
Finally, security workarounds that employees may be
using should be identified and mitigated by designing
policies that support work efficiencies but also strong
security-minded behaviors.

Even though this case study examined poll worker
behavior intentions, the same approach can be applied
when considering the cyber, physical, and insider security
of supply chains. For example, if the organization is
worried about data breaches, it can deploy the inventory
and use highly-correlated SeBIS intentions to understand
current employees’ behavior intentions, followed by
developing and/or adjusting policies, practices, and
training accordingly to help prevent a breach.

An organization can also use SeBIS to gain insight on
its data locality, data visibility, fraud prevention, and
third-party risk. A related example is the March 2021
SolarWinds data breach. In early 2020, hackers secretly
broke into SolarWinds and added malicious code to the
software system (Jibilian, 2021). SolarWinds unwittingly
sent out software updates to its customers that had the
malicious codes, which created a backdoor to customers’
IT systems. Then the hackers installed even more
malicious codes that helped them spy on companies
and organizations.

The need for organizations to develop a proactive security
posture to protect the integrity of sensitive data
and processes is essential to maintain public trust and
organizational viability. Yet, many organizations focus
solely on developing risk assessments and mitigations
to protect from external actors; an organization intent
on developing a strong security posture needs to additionally
understand, assess, and train for risks that may
arise from insiders.

References

ARLIS: Applied Research Laboratory for Intelligence and Security.
(2021, March 30). IRISS event summary #1: State of insider threat and
insider risk paradigms. https://arlis8.umd.edu/iriss-event-summary-
1-state-insider-threat-and-insider-risk-paradigms-1

Black, L., Scala, N. M., Goethals, P. L., & Howard II, J. P. (2018). Values
and trends in cybersecurity. Proceedings of the 2018 Industrial and
Systems Engineering Research Conference. https://tinyurl.com/Black-
EtAl2018

Cybersecurity and Infrastructure Security Agency. (2021, September
28). Insider threat mitigation. https://www.cisa.gov/insider-threatmitigation

Department of Homeland Security. (2020, July 14). Election security.
https://www.dhs.gov/topic/election-security

Deville, T. (2020, October 16). Towson University professor aims
to bolster local election security at voting sites. The Baltimore
Sun. https://www.baltimoresun.com/maryland/baltimore-county/
cng-co-ca-at-towson-election-security-20201016-vrovdo7qyvdu7h2nmyk7addbli-
story.html

Egelman, S., Harbach, M., & Peer, E. (2016). Behavior ever follows
intention? A validation of the Security Behavior Intentions Scale
(SeBIS). Proceedings of the 2016 CHI Conference on Human Factors in
Computing Systems, 5257-5261.

Egelman, S. & Peer, E. (2015). Scaling the security wall: Developing a
Security Behavior Intentions Scale (SeBIS). Proceedings of the 33rd
Annual ACM Conference on Human Factors in Computing Systems,
2873-2882.

Farahani, J., Scala, N. M., Goethals, P., & Tagert, A. (2016). Best
practices in cybersecurity: Processes and metrics. Baltimore Business
Review: A Maryland Journal, 28-32.

Jibilian, I. (2021, April 15). The US is readying sanctions against Russia
over the SolarWinds cyber-attack. Here’s a simple explanation of how
the massive hack happened and why it’s such a big deal. Business
Insider. https://www.businessinsider.com/solarwinds-hack-explainedgovernment-
agencies-cyber-security-2020-12.

Kraska-Miller, M. (2013). Nonparametric statistics for social and behavioural
sciences. Boca Raton: CRC Press.

Scala, N. M., Dehlinger, J., Black, L., Harrison, S., Delgado Licona, K.,
& Ieromonahos, A. (2020). Empowering election judges to secure our
elections. Baltimore Business Review: A Maryland Journal, 8-20.

Scala, N. M. & Goethals, P. L. (2020). A model for and inventory of
cybersecurity values: Metrics and best practices. In N. M. Scala and
J. P. Howard II (Eds.), Handbook of Military and Defense Operations
Research (pp. 305-330). CRC Press.

Taxing the Digital Economy Maryland is the First U.S. State to Pass a Digital Advertising Tax

Nicola Daniel
Senior Advisor to the Center for Financial Policy
at the University of Maryland’s RH Smith School of Business

Reining in the darker side of big tech companies has
been the battle cry of many economists, legislators, and
data privacy experts for over a decade. Why? Because big
tech’s scale and global reach have evolved to the point
where they undermine, if unintentionally, the foundation
of free markets and democratic institutions with their
market power and political advertising. Policymakers,
including Nobel Prize-winning economist Paul Romer,
think the U.S. needs to rewrite economic policy for the
big tech era.

Romer’s argument for taxing Facebook and similar companies
rests on the fact that they drive their business
through algorithms that increase user engagement and
revenues by actively encouraging anger and disagreements,
so they are manipulating users “in ways that
they don’t fully understand.” This is not how markets
usually work. As Romer explains, “When economists
defend the market, we have this very simple idea in
mind, where I as a buyer give something and get some
good back.” That doesn’t happen in this new market for
digital services, in which advertising becomes a “hidden
method of capturing compensation for these firms.”

Inspired by Paul Romer’s op-ed on digital taxation in
the New York Times, Maryland State Senate President
Bill Ferguson pushed through the first digital advertising
tax in the U.S. in February 2021. The tax runs up to
10% on revenues companies receive from selling digital
ads that target Maryland IP addresses. It defines digital
advertising as services delivered on any type of software,
website, or application that a person can access on a
device. These include banner advertising, search engine
advertising, and other comparable advertising services.
Such ads tailor content based on users’ demographics
and browsing history.

Firms with less than $100 million in annual global digital
ad revenue are exempt from the Maryland tax. This
high threshold is designed to target the largest internet
companies, such as Google, Twitter, and Facebook, which
account for roughly 59% of the $130 billion digital ad
revenue market in the U.S., according to research firm
eMarketer. The tax is projected to yield up to $250 million
annually and was enacted just one week after legislators
amended the state sales tax to include “digital products”
and software as a service (SaaS).1

For Maryland small businesses, residents, and the state’s
budget, this tax makes sense, as it helps to level the
playing field between digital behemoths and smaller
companies. There are four core reasons legislators pushed
the new digital advertising tax. First, a digital tax seeks
to remedy the problem of jurisdictional tax arbitrage,
which results from companies profiting from differences
in systems of taxation. Second, it addresses the
fact that generating profit from gargantuan data caches
incentivizes companies to invade consumers’ privacy
in unprecedented ways. Third, it replaces tax revenues
lost from other sources. Finally, it encourages healthy
competition and punishes monopolies.

1 The new law defines a digital product as “a product that is obtained
electronically by the buyer or delivered by means other than tangible
storage media through the use of technology having electronic, digital,
magnetic, wireless, optical, electromagnetic, or similar capabilities.”
The law also adds SaaS, subscriptions, streaming services and “digital
codes” as taxable transactions.

The Logic of Digital Advertising Taxes

1. Tax Arbitrage
A 2021 report from the U.S. Treasury notes that “although
US companies are the most profitable in the world, the
U.S. collects less in corporate tax revenues as a share of
GDP than almost any advanced economy” at 1% of U.S.
GDP versus 3.1% of Organization of Economic Cooperation
and Development (OECD) country GDP. Regulators
in Europe have been less forgiving of tax arbitrage than
the U.S. In one case, Apple, the world’s largest company
by market capitalization, was presented with a $15.2
billion tax bill after the European Commission ruled
that Apple’s deal with Irish tax authorities constituted
illegal state aid. The commission showed that the deal
allowed Apple to pay a maximum tax rate of just 1%.
In 2014, the tech firm paid tax at a rate of only 0.005%.
The usual corporate tax rate in Ireland is 12.5%.

Google points out that its advertising sales do not take
place in a specific country, but via an auction algorithm
that is operated by algorithms whose physical location
is undefined. Hence, online advertising should not be
taxed by jurisdiction, according to Google’s argument.
The Maryland tax refutes this logic by linking advertising
directly to the IP addresses of Maryland consumers.
IP addresses are not a foolproof method of locational
identification, as critics have argued. Nonetheless, digital
ad taxes significantly curtail the ability for corporations
to engage in jurisdictional tax arbitrage.

2. Data Privacy
A digital advertising tax recognizes that companies with
massive data caches like Google, benefit financially
from the volume of individual consumer data without
economically compensating the data subject. The digital
tax thus represents the interests of Maryland residents
who provide that digital data.

Big tech’s incursion into consumer privacy has been welldocumented
in books including The Age of Surveillance
Capitalism and An Ugly Truth, a 2021 book describing
Facebook’s internal drift toward greater invasiveness
based on the profit motive.

The digital tax also responds to the federal government’s
failure to regulate consumer data privacy. The
European Union (EU) has strictly protected consumer
data privacy since 2018 through the Global Data Privacy
Regulation (GDPR).

In contrast, U.S. regulators ineffectively encouraged
companies to self-regulate. When the Federal Trade
Commission (FTC) fined Facebook $5 billion for the
Cambridge Analytica data privacy breach in April 2019,
Facebook’s stock price soared because the fine was
negligible compared to what regulators might have
levied. Since then, Facebook broke its pledge to the FTC
to keep barriers between its Instagram and WhatsApp
applications, allowing it to glean more data on its users.

The GDPR grants consumers in Europe the right to
obtain information about the data companies store on
them, as well as the right to have their data deleted.
More importantly, it grants individuals the right to sue
firms. In 2020, Max Schrems, an Austrian lawyer, sued
Facebook through the Irish Data Protection regulator
and prevailed. This suit nullified the Privacy Shield
agreement between the U.S. and the EU that allowed
for data transfers between companies across the Atlantic,
and it is forcing the U.S. to ensure better privacy
measures for consumers. There are currently six data
privacy laws proposed in Congress. Only two of them
allow individuals the right to sue, whereas the other four
require regulators to take offenders to court, suggesting
less enforcement due to capacity constraints.

Figures 1 and 2

3. Replacing Lost Tax Revenue
Maryland needs to replace income lost by the shrinking
of once-robust sources. For example, gas taxes, which
were once a major source of state government revenue,
have drastically fallen with increased electric vehicle use.
COVID-19 worsened this trend as driving plummeted
nationwide by 38% in the initial months of the pandemic.
Maryland experienced a 6% decline in gas tax revenues
in 2020. Overall, Maryland expects a $673 million tax
revenue shortfall—3% of projected revenues—in 2021.

Meanwhile, online tech giants grabbed unprecedented
market share as social distancing accelerated the shift
toward digital platforms. Google’s revenues grew by $20
billion to $181.9 billion in 2020. Its year-end net profits
as of June 2021 stood at a staggering $122.73 billion.
Similarly, Facebook’s revenues grew by $15.4 billion
to $86 billion in 2020, with net profits of $29.1 billion.

The annual $250 million projected tax revenue boost
from the digital advertising tax goes a long way toward
plugging Maryland’s COVID-related shortfall while
scarcely affecting the profit margins of digital giants.

4. Discouraging Monopoly
Finally, the digital tax provides incentives for healthy
market competition from smaller companies because
the more advertising revenue a firm collects, the higher
its tax rate. If a firm splits itself, e.g., if Facebook were to
spin off Instagram, the total tax bill for the two firms as
separate entities would be smaller. These higher taxes
for larger entities also discourage the kind of growth
by acquisition that drives digital giants to acquire their
potential competitors only to kill them.

Firms seeking to avoid the tax can opt for a subscription
revenue model. Subscriptions conform to a more
traditional economic framework in which consumers pay
something to get access to something valuable and the
balance of supply and demand determines the market
price. The New York Times, for example, switched from
an ad-only revenue stream to a subscription-driven
revenue stream with resounding success. Today, The
New York Times is financially healthy and dominates
online news searches.

Global Digital Tax Trends

Will Maryland be joined by other states in imposing a
digital tax? Or will it be isolated and face pressure that
may force it to end this tax?

Maryland’s digital ad tax is part of a much larger national
and global trend. As of March 2021, 26 European countries
imposed unilateral digital taxes on services like
software subscriptions, video streaming, and audiobooks.
They targeted firms that have many users in Europe and
yet pay few taxes there. The U.S. protested, claiming that
the policy would disproportionately affect U.S.-based
tech companies.

The European taxes led to negotiations, spearheaded
by the OECD and the EU, seeking to harmonize digital
taxation. The OECD has led discussions among 137
jurisdictions to establish rules about where taxes should
be paid and how profits should be allocated. Because
U.S. firms are disproportionately affected by such taxes,
U.S. regulators have increasingly participated in discussions.
The negotiations have driven economic research
that has led to a greater convergence of attitudes toward
digital taxation between the U.S. and OECD countries.

Looking Ahead

Domestic legal challenges to Maryland’s digital tax
have surfaced. In February 2021, the U.S. Chamber of
Commerce filed a suit against Maryland to challenge
the digital advertising tax, arguing that it violates the
federal Internet Tax Freedom Act. Other plaintiffs have
followed. These challenges are likely to meet with some
success and will require modifications to the existing
law. As a result, the Maryland General Assembly passed
an emergency bill to delay the digital tax’s implementation
to 2022. However, the U.S. Senate testimony of
former Facebook employee Frances Haugen in October
2021 added fuel to the drive to take regulatory action
against the larger digital platforms on multiple fronts
and may well bolster the popularity of digital taxes.
Many states—including Texas, West Virginia, Massachusetts,
and New York—are following Maryland’s lead in
introducing digital tax legislation. The digital tax trend
is not likely to abate soon.

References

“Once Tech’s Favorite Economist, Now a Thorn in Its Side,” The New
York Times (May 20, 2021).

“Taxing digital advertising could help break up big tech,” MIT Technology
Review (June 14, 2021).

“Opinion | A Tax That Could Fix Big Tech,” The New York Times (May
5, 2019).

“Duopoly still rules the global digital ad market, but Alibaba and
Amazon are on the prowl,” Insider Intelligence Trends, Forecasts &
Statistics (May 10, 2021).

MadeInAmericaTaxPlan_Report.pdf (treasury.gov). See also “Trends
and Proposals for Corporate Tax Revenue,“ Congressional Research
Service, August 27, 2021.

Apple ordered to pay €13bn after EU rules Ireland broke state aid
laws | Tax avoidance | The Guardian.

Zuboff, Shoshanna (2019). The Age of Surveillance Capitalism. New
York, Hachette Book Group.

Frenkel, S. and C. Kang (2021). An Ugly Truth. New York, Harper
Collins, pp. 226.

“FTC Imposes $5 Billion Penalty and Sweeping New Privacy Restrictions
on Facebook,” Federal Trade Commission (July, 2019).

“Amazon fined record $887 million over EU privacy violations,” The
Verge (July 30, 2021).

“Gas Tax Revenue to Decline as Traffic Drops 38 Percent,” Tax Foundation.
org (March 31, 2021).

Motor Fuel Tax and Motor Carrier Tax IFTA Annual Report (marylandtaxes.
gov).

States Grappling With Hit to Tax Collections | Center on Budget and
Policy Priorities (cbpp.org).

source: Statista.com.

The nations include: Argentina, Austria, Costa Rica, Germany, Greece,
Hungary, India, Indonesia, Italy, Kenya, Malaysia, Mexico, Nigeria,
Pakistan, Paraguay, Poland, Sierra Leone, Spain, Taiwan, Tunisia,
Turkey, United Kingdom, Uruguay, Vietnam, Zimbabwe. Source:
americanactionforum.org.

“Maryland To Delay Controversial Digital Advertising Tax As The
Lawsuits Keep Coming,” Forbes (April 17, 2021).

Does it Pay to Have Women on Corporate Boards? Building a Business Case for Gender Diversity

Shaneeza Baksh
Major in Business Administration, Towson University

Nhung Hendy
Professor, Department of Management, Towson University

Introduction

Diversity, inclusion, and equity have received growing
interest among executives and management researchers
for at least two reasons. First, there is a business
case for promoting diversity, inclusion, and equity in
organizations including increased innovation, employee
engagement, revenue, and profits (e.g., Bourke et al.,
2017). Recently, a large-scale meta-analysis reported that
gender diversity on corporate boards of directors was
positively related to improved board decision-making,
board attendance, and firm’s financial performance (Halliday
et al., 2021). Second, advancing diversity, inclusion,
and equity is the right thing to do under the justice view
of ethics as organizations move beyond legal compliance
to avoid workplace discrimination (Noon, 2007).

Despite nearly six decades since the passage of the Civil
Rights Act in 1964, the progress toward gender diversity,
equity and inclusion in the U.S. corporate board rooms
has been slow (Halliday et al., 2021). According to the
latest data, in 2019, women held 22% of board seats in
Russell 3000 companies (2020 Women on Boards, 2020)
even when their participation in the workforce was more
than 50% (Civilian Labor Force, 2021). One reason that
might explain the lack of women on corporate boards
is the structural deficit of female students majoring in
finance or corporate finance as documented in at least
one study using longitudinal data covering 2009 to 2018
undergraduate enrollment (Hawash, & Stephen, 2019).

In addition, there was a decline in women serving as
portfolio-managers, a typical role before being promoted
to a corporate board member (Rogow, 2017).

To remedy the situation, in 2018, Women on Boards
was signed into law in California to advance equal
representation along gender line on corporate boards
of publicly traded firms in California (CA Secretary of
State, 2018). Specifically, one or two female directors
would be required contingent upon the size of the publicly
traded firm by the end of 2021. However, as of this
writing, California is the only state in the U.S. that has
mandated a gender quota on corporate boards and its
impact on firm performance has yet to be established. In
this study, we argued that having women on corporate
boards is aligned with the view of managing stakeholder
groups based on Freeman’s (1984) stakeholder theory of
strategic management. In contrast to Friedman’s (1970)
shareholder theory in which the sole responsibility of
the firm is to maximize shareholders’ return on investment,
stakeholder theory views that both shareholders’
value and stakeholders’ value (e.g., employee satisfaction
and productivity) can be achieved. An anecdotal
evidence is given to illustrate the dualities of having
both shareholders’ and stakeholders’ interests served
by filling the gender gap on corporate boards. In 2018,
T. Rowe Price, a Fortune 500 company headquartered
in Baltimore, Maryland, voted to add a female director
to their Board of Directors, raising the number of female
directors from three to four out of an eleven-member
board size. Following this increase in board’s gender
diversity, they saw an increase in productivity, evidenced
by a gain in revenue per FTE from $696,556 in 2017
(before) to $762,797 in 2019 (after) – a productivity gain
of $66,241. In addition, shareholders also benefited
from an increase in shareholder’s return on equity from
27.15% to 31.67% – a gain of 4.52%.

Methodology

We conducted an empirical investigation to test Freeman’s
(1984) stakeholder theory. A stratified random
sample of 100 companies with 10 each representing 10
sectors from the Standard & Poor 500 was included. The
10 sectors included were Basic Materials, Communication
Services, Consumer Cyclical, Consumer Defensive,
Energy, Financial Services, Healthcare, Real Estate,
Technology, and Utilities. We used publicly available data
including the firm’s annual financial reports and proxy
statements filed with the Securities and Exchange Commission
to extract usable data for analysis. We restricted
our analysis to 2019 data to control for the COVID-19
pandemic impact on the firm’s performance. The number
of women serving on corporate board by the end of 2019
was used as an indicator of gender diversity on corporate
boards. Other variables including number of directors
on the corporate board (board size), number of full-time
equivalent employees of the firm (firm size) and the sector
were used as control variables. In this study, corporate
boards varied in size from 5 to 17 with a median of 11
directors. The number of women on corporate boards
ranged from 1 to 7 with a median of 3 women directors.
Outcome variables include shareholder’s return
on equity and revenue per full-time employees (FTEs).
Nine dummy coded variables were created to represent
the 10 sectors in all statistical analyses with consumer
defensive as the reference sector. We used a median
split of 27% of female representation (or 3 women) to
create a dichotomous variable of gender diversity on
corporate boards. Firms that have 27% or less of women
serving as directors (47) were classified as low in gender
diversity whereas firms that had more than 27% women
(53) were classified as high in gender diversity on their
corporate boards.

Results

We conducted two hierarchical regression analyses in
which we regressed sector dummy variables and firm
size onto shareholder’s return on equity (ROE) in the first
step, and gender diversity on boards in the second step,
and found that firms that had 3 or more women on their
corporate boards had an average gain of about $0.22
in ROE relative to firms having fewer than 3 women in
their corporate boards after controlling for firm size and
sector (See Table 1 and Figure 1). In addition, board’s
gender diversity explained 2% of incremental variance
in shareholder’s ROE.

Next, we performed the same hierarchical regression
but this time, in the second step, we regressed gender
diversity onto revenue per FTE. As shown in Table 1,
board gender diversity had a positive and significant
influence on firm’s productivity after controlling for sector
and firm size (β = 0.18, p < .05). Converting this statistical
finding into dollar terms, firms that had 3 or more
women on their boards had more productive employees
compared to firms with fewer women on their boards.
On average, the firm’s productivity gain was $414,469.
Figure 2 shows a breakdown of gender diversity effect
on firm’s productivity by sector. Our findings provided
support to Freeman’s (1984) stakeholder theory such that
having more women on corporate boards benefited both
shareholders and employees, an important stakeholder
group. In addition, the study findings provided support
to viewing shareholders and stakeholders as interdependent
and complementary, rather than opposing forces.
Our findings can be explained by the differentiated
perspectives between genders such as the feminine
management style (Carter & Williams, 2003). Specifically,
female directors were more likely to monitor executive
decision making than male directors (Triana et al.,
2013). In addition, female directors were more likely to
encourage governance practices benefiting stakeholder
groups (e.g., corporate social responsibility), rather than
just shareholders (Halliday et al., 2021). Our study is not
without limitations. First, the sample of firms included
in the study was small, which may hinder the external
validity of the study. Second, we only examined gender
diversity and firm performance for one year period,
rather than multi-year period. Therefore, a longitudinal
study is needed in future research to further validate our
findings. Third, future research should examine diversity
on corporate boards in terms of the CEO’s gender, age,
and disabilities to be more inclusive.

Conclusions

This study provides data supporting that it pays to
increase gender diversity on corporate boards in the
U.S. Women directors can and will positively impact
firm performance through increasing shareholder’s
value while at the same time benefiting employees, an
important stakeholder group. As the sample of firms in
this study includes several that are headquartered in
Maryland, this study is relevant to our regional economic
sustainable development because it raised awareness
that there is a business case or a sustained competitive
advantage for firms to advance equal gender representation
in the corporate board room.

References

Bourke, J., Carr, S.S., Berkel, A.V., & Wong, J. (2017). Diversity and
inclusion: The reality gap. Deloitte Global Human Capital Trends,
107-117.

Carter, N. & Williams, M. (2003). Comparing social feminism and
liberal feminism: the case of new firm growth. In Butler, J. (Ed.), New
Perspectives on Women Entrepreneurs. Information age publishing,
Cap, 2, pp. 25-50.

California Secretary of State (2018). Women on Boards. Retrieved from
https://www.sos.ca.gov/business-programs/women-boards

Civilian labor force participation rate by age, sex, race, and ethnicity
(2020, September 01). Retrieved April 23, 2021, from https://www.bls.
gov/emp/tables/civilian-labor-force-participation-rate.html

Freeman, R.E. (1984). Strategic Management: A stakeholder approach.
Cambridge University Press. Cambridge: U.K.

Friedman, M. (1970). A Friedman doctrine – the social responsibility
of business is to increase its profits. The New York Times, September
13th. Retrieved from https://www.nytimes.com/1970/09/13/archives/afriedman-
doctrine-the-social-responsibility-of-business-is-to.html

Halliday, C. S., Paustian-Underdahl, S. C., & Fainshmidt, S. (2021).
Women on boards of directors: A meta-analytic examination of the
roles of organizational leadership and national context for gender
equality. Journal of Business and Psychology, 36, 173-191.

Hawash, R., & Stephen, S.-A. K. (2019). Where Are All the Female
Finance Majors? An Examination of Gender and Performance in
Undergraduate Corporate Finance. Journal of Higher Education Theory
and Practice, 19(8). https://doi.org/10.33423/jhetp.v19i8.2674

Noon, M. (2007). The fatal flaws of diversity and the business case for
ethnic minorities. Work Employment, and Society, 21, 773-784.

Rogow, G. (2017). A plan to fill the massive gender gap in asset
management: Nonprofit group Girls Who Invest looks to fill industry
job pipeline with more women candidates. Wall Street Journal, Issued
July 28th.

Triana, M. D. C., Miller, T. L., & Trzebiatowski, T. M. (2013). The doubleedged
nature of board gender diversity: Diversity, firm performance,
and the power of women directors as predictors of strategic change.
Organization Science, 25, 609-632.