
Farhan Mustafa, CFA
Head of Investment Risk Management and Head of Quantitative Investments, ClearBridge Investments
Last year’s Baltimore Business Review covered a speech
by former Federal Deposit Insurance Corp. Chair Sheila
Bair in which she expressed concern over the record
level of debt among U.S. businesses. This article updates
the analysis and provides a deeper quantitative dive
into the leverage profile of S&P 500 companies. It
also considers how those profiles should factor into
stock analysis.
Federal and Corporate Debt Hits Record Levels
U.S. companies and the federal government have issued
record levels of debt in recent years, largely due to nearly
a decade of record-low interest rates. Figure 1 shows
that federal debt currently represents 136% of GDP
(blue line) and corporate debt represents 56% of the
national output (gray line), both of which are historic
highs since at least 1965.. Debt levels as of the end of
2020’s second quarter were: $10.99 trillion nonfinancial
corporate, $26.48 trillion federal, and $16.14 trillion
household and nonprofit. Each of these debt levels
represents absolute historic highs. The latest observation
for the second quarter of 2020 looks especially
dramatic due to the onset of the COVID-19 pandemic
as U.S. GDP declined 9.5%, while federal debt increased
14.0% and corporate debt increased by 3.3%.

Figure 1 also shows an uptick in U.S. household debt to
83% of GDP (gold line) at the end of the second quarter.
However, unlike the financial crisis of 2008–2009, the
rise in consumer debt is significantly lower, which is
consistent with Ms. Bair’s observation last year that
U.S. households’ low indebtedness has been a positive
development.
As noted above, the latest increases in federal and corporate
debt in Figure 1 were worsened by the sharp
decline in GDP caused by the widespread economic
shutdown to fight the coronavirus. It would be reasonable
to see a similarly sharp decline in these ratios once
GDP rebounds in a post-pandemic world. However,
the data series were at historic highs even before the
COVID-19 pandemic-related spike, and there are no
signs of a meaningful reduction in these ratios because
most central banks and governments remain committed
to accommodative fiscal and monetary policies to
fight the economic slowdown from the coronavirus.
These aggressive policy measures are appropriate to
manage the fallout from the global pandemic. But these
accommodative monetary and fiscal policies come on
the heels of multiple years of accommodative policies
that have virtually eliminated the potency of interest
rates as a policy tool around the world. Developed
economies around the globe have been issuing negativeinterest-
rate debt for several years. As Figure 2 shows,
there is nearly $16 trillion of negative-yielding debt
outstanding as of September 30, 2020, with Japan
representing nearly one-third, and Germany and France
each representing one-sixth of the total.
Negative-yielding debt condemns bondholders to lose
money if they hold the issue to maturity. At the macroeconomic
level, central banks in Japan and Europe are
using this as a monetary policy tool to encourage banks
to lend and stimulate the economy. At the microeconomic
level, investors may tolerate negative-yielding
bonds due to anticipation of even worse returns in
other investments. For traders, negative-yielding debt
could simply be an outcome of positive momentum
in the price of these bonds, where successive trades at
higher prices are profitable as yields move further into
negative territory.
Pressure Is Building
There is a logical narrative for why U.S. corporate and
federal debt are at historic highs—both absolutely and
relative to GDP. There is also a rational explanation
for why developed economies are awash in negativeyielding
debt. However, it is unreasonable to expect
these trends to continue without a major disruption
or reversion to their long-term averages because these
dynamics come with ever-increasing risks. These trends
represent pressure building beneath the surface of an
otherwise profitable and rising market.
It is possible that large-scale fiscal spending into the
global economy’s long-term productive capacity would
generate sufficient economic productivity to pay off all
the debt, especially with such low interest rates. But what
if productivity does not support enough real economic
growth to carry the debt burden? In such a scenario, the
aggressive policy measures would result in inflationary
pressures and higher interest rates, even if we get some
nominal economic growth. It is also worth considering
more stressful scenarios, such as a crisis of confidence
in the creditworthiness of the borrowers in a modest
economic recovery, in which case the higher cost of
borrowing would likely push levered businesses into
distress or even bankruptcies. Or, what if geopolitical,
socioeconomic, or existential risks like war, income/
wealth inequality, climate change, etc., disrupt the
socioeconomic stability required to bring the global
debt load to more reasonable levels? We can present
lengthy analyses about each of these scenarios, but the
key point is there are multiple scenarios in which the
current debt regime could prove unsustainable and
result in individual company bankruptcies or even a
systemic debt crisis.
A debt crisis happens when an entity (corporate or governmental)
defaults on its loans. From Latin America’s
lost decade in the 1980s to the 2008–2009 credit crisis
in the U.S. and the European Union, there are plenty
of painful reminders of what happens when countries
cannot service their debts. A debt crisis can undermine
the stability of financial systems in the crisis-hit
country, and also spread to other countries, especially
for strategically connected economies like the European
Union and Japan. This can hit economic growth, as
well as create turmoil in global financial markets. If a
country’s debt crisis is severe enough, it could result
in a sharp economic slowdown at home that drags on
growth elsewhere.
This analysis is not meant to predict an impending
global debt crisis. The economy and the stock market
are complex adaptive systems in which agents adapt
to current conditions, and the eventual outcomes are
often very different from linear extrapolations of recent
events. Rather, the point is that highly levered agents
(companies, governments, etc.) would be at greater
risk of bankruptcies than unlevered agents in a higherrate
environment. Therefore, the rest of this article
analyzes the leverage risk of S&P 500 companies to
help identify highly levered and unlevered investment
opportunities. At the outset, it is important to note
that leverage analysis should not be the entire basis of
an investment decision, but it should be a key component
of a more comprehensive stock analysis for any
investment decision.
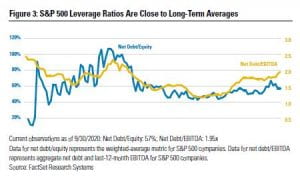
A Closer Look at U.S. Corporate Debt
Figure 3 shows leverage (net debt/equity) and debt-servicing
(net debt/EBITDA) ratios for S&P 500 companies
from 1990 to the second quarter of 2020. In terms of
overall leverage, net debt represents 57% of the equity
as of Sept. 30, 2020, which is in line with its long-term
average of about 60%. From the perspective of being
able to repay the debt, net debt represents 1.95 times
EBITDA as of Sept. 30, 2020, which is modestly above
its average of 1.69x since 1990.
On the surface, using sensible high-level metrics like
weighted-average net debt/equity and aggregate net
debt/EBITDA, S&P 500 stocks do not appear to have
elevated leverage in the aggregate. However, a breakdown
of the index constituents into the most- and
least-levered stocks presents a much different picture.
Table 1 shows the breakdown of S&P 500 companies
into the 20% most-levered stocks, the “middle” 60%,
and the 20% least-levered stocks, based on net debt/
equity and net debt/EBITDA metrics. For each metric,
the “average” column shows an unweighted average
statistic for each group and the “index weight” column
shows the percentage of index weight in each group.
Table 2 shows the sector breakdown of the stocks in
each bucket based on the net debt/equity and net debt/
EBITDA metrics.
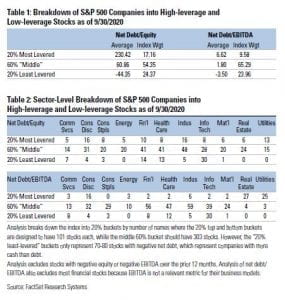
Around one-quarter of the S&P 500 Index consists of
stocks with negative net debt/equity and net debt/EBITDA
metrics, which typically means these stocks have net cash,
or more cash than debt.1 From Table 2, we can further
see that the majority of these companies are in the information
technology sector. These companies represent a
larger percentage of the market capitalization-weighted
S&P 500 Index than their unweighted number, indicating
that these tend to have higher market capitalizations
than stocks in the other buckets.
Management teams at these companies are taking
advantage of the low-cost debt available in the market,
and their ability to pay down their debt with cash at
hand means these tend to be low-leverage-risk investment
opportunities. This does not necessarily mean
such low-leverage-risk stocks are good investments,
because there is also valuation risk. An investor would
have to analyze many more aspects of the stock and
the company before making that decision.
Among Maryland-based companies, T Rowe Price
(ticker: TROW) is in the least-levered group on both
net debt/equity and net debt/EBITDA metrics.
On the other end of the spectrum, 10% to 17% of S&P
500 stocks have net debt representing multiples of their
shareholders’ equity and/or trailing-12-month EBITDA.
These stocks represent 20% of the index in terms of
the number of companies, but a smaller percentage
in terms of index weight, which indicates a smallermarket-
capitalization bias in this group. Consumer
discretionary and utilities represent the largest share
of highly levered companies on both leverage metrics,
and numerous industrials and real-estate companies
are also highly levered, based on net debt/equity and
net debt/EBITDA, respectively.
Among Maryland-based companies, Apartment Investment
& Mortgage (ticker: AIV), Extra Space Storage
(ticker: EXR), Federal Realty Investment Trust (ticker:
FRT) and UDR (ticker: UDR) are four local REITs (realestate
investment trusts) in the most-levered category,
based on both leverage metrics.
Being Highly Levered Is Sometimes OK
Being among the most-levered stocks does not necessarily
mean these stocks should be avoided in a portfolio.
A large debt load is part of the business model for many
businesses, such as utilities and real-estate companies.
For this reason, it is up to each investor to analyze stocks
with high leverage ratios to determine whether the leverage
is appropriate for the business model and to assess
its impact on the investment’s overall attractiveness. In
fact, detailed analysis of a levered company that has
the business fundamentals to manage the debt through
difficult times might create an opportunity to invest
at an attractive entry point, if the stock trades down
with other levered stocks in a distressed environment.
Additionally, simple leverage ratios such as those in
this analysis do not constitute a complete analysis of
a stock’s leverage risk or its merits as an investment
opportunity. However, many passive and algorithmic
investment vehicles rely on simple ratios to divide an
investment universe into attractive and unattractive
buckets, and to create long-short portfolios2 to capture
the performance differential of stocks in each bucket.
This is a simplistic description, but the key point is that
the widespread popularity of passive investment vehicles
makes it common to find sharp stock price movements
because the stock is part of a thematic bucket, rather
than because of its fundamentals. In this way, these
metrics’ simplicity can be a powerful causal factor in
framing securities and driving their prices.
Conclusion: Higher Risk of Debt Crisis
and More Need for Leverage Analysis
Rising levels of debt at the federal and corporate levels
are increasing the risk of corporate bankruptcies and
a debt crisis as interest rates eventually return to more
normalized levels. This risk may not be at the forefront
of investors’ attention due to historic levels of fiscal and
monetary stimulus around the globe, but the pressure
is building under an otherwise calm surface of increasing
indebtedness. For investors, it is inappropriate to
generalize the effects of high leverage on individual
companies because so much depends on an individual
industry’s or company’s business model. Detailed leverage
analysis should be in every investor’s stock analysis
toolkit. This would help avoid the risk of distress in
highly levered companies and protect clients’ capital
in case of a debt crisis. At the same time, such analysis
could create investment opportunities if highly levered
companies become undervalued and less-levered companies
become overvalued as quantitative strategies use
leverage as a crude measure of attractiveness.
References
Mustafa, Farhan (2020). “Former FDIC Chair Sheila Bair Is
Optimistic About the Potential of Technology to Improve Financial
System, While Expressing Concern About Non-Financial Debt
Segment of the Market,” Baltimore Business Review.
O’Malley, Niall (2020). “When Does A Good Investment Become
a Bad Investment?” Baltimore Business Review.