
Riya Patel
Major In Business Administration, Towson University
Stella Tomasi
Associate Professor, Department Of Business Analytics & Technology Management, Towson University
Introduction
Data science is a field that uses scientific methods, processes,
and systems to extract insight and knowledge
from structured and unstructured data. The amount of
the data is growing exponentially. About 33 zettabytes
of data was generated in 2018 and it is estimated that
there will be 175 zettabytes in 2025 (Novikov, 2020).
Data Science/Business Intelligence/Analytics were identified
among “the top 10 most sought-after skills” by
Computerworld (Pratt, 2016). The Bureau of Labor
Statistics estimates growth in the field of data science
and business analytics to 11 percent through.
The use of advanced computing technology to improve
medical care is called healthcare analytics. Medical care
is a critical sector where analytics can help to identify
best approaches. The three areas that healthcare analytics
can help with are – have better outcomes, reduce the
cost of healthcare and ensure quality care. Historical
data in these areas are used to identify patterns that
can help with decision making.
Healthcare Analytics during the Pandemic
Healthcare analytics is especially crucial during the
current global pandemic. Coronavirus observation
draws from a mix of information sources from existing
flu and viral respiratory infection surveillance,
syndromic observation, case detailing, business lab
revealing, continuous exploration stages, and other
new frameworks intended to address explicit inquiries
(CDC, 2020). These frameworks consolidated make a
refreshed, exact image of SARS-COV-2 spread and its
belongings in the United States and give information
to illuminate the U.S. public general wellbeing reaction
to COVID-19 (CDC, 2020).
Outbreak analytics takes all accessible information,
including the quantity of affirmed cases, deaths, following
contacts of contaminated individuals, populace
densities, maps, voyager stream, which are only the tip of
the iceberg. Such information is then measured through
AI to make models of the infection (Marr, 2020). These
models speak to the best expectations with respect to
top disease rates and results (Marr, 2020). According to CDC (2020),
a form is developed to help tracking
the reports of COVID-19. These forms are then entered
into the database and analyzed which helps to track the
impact of the outbreak and inform the public accordingly
on new places infected with the virus.
Data analytics can also be used in detecting virus. If
the patient has been detected with the virus, he/she
must get tested and have CT scans performed. The
CT scans can be then stored and used to compare with
future cases. This way we can keep track of any new
symptoms detected and keep track of how the virus is
changing and impacting individuals.
On example of data analytics is the online dashboard
built by the Center for Systems Science and Engineering
(CSSE) at Johns Hopkins University, which tracks
affirmed COVID cases, deaths, and recuperations for
every influenced nation (Kent, 2020). Johns Hopkins
University and the University of Washington facilitated
an elevated discussion, “Preserving The Scientific
Integrity of COVID-19 Vaccine Efficacy Trials: From
Clinical Trials to Public Allocation”, that investigated
complex issues, united driving voices in the field, and
set forward a succinct arrangement for ensuring the
logical trustworthiness of these progressing endeavors.
This arrangement of brief reports provided insights
into COVID-19 antibody improvement, allotment,
and organization in the United States and universally
(John Hopkins University & Medicine, 2020). The
Johns Hopkins COVID-19 following guide, created by
Lauren Gardner and her group at the Center for Systems
Science and Engineering, has become an authoritative
on the COVID data. Gardner and her team shared the
data to increase cooperation around the world. Tableau
has distributed the open-source data set through their
platform to grant other vendors/individuals access to
the COVID data.
Data Analytics in Pharmaceutical Industry: A Local Example
In the pharmaceutical industry, data analytics is helping
organizations to manage declining achievement rates
and stale pipelines. The usage of collected datasets
can help pharmaceutical organizations develop drugs.
Likewise, analytics has empowered organizations to
improve clinical trials, oversee chances productively,
and improve persistent wellbeing. Analysts are using
their skills to help drug companies set prices for new
medicines and choose the most effective promotion
campaign. Data analysts also analyze clinical trials to
find the efficacy of the drug in subjects. They can review
data and create models to find an effective enrollment
forecast for specific trials that will allow for accurate
budget identification. Using data insights, pharmaceutical
companies can start to reach out to doctors
and advise them on how certain medications can help
patients in their treatment plans. Analytics can also
help companies identify different financial plans for
different medicines.
As a part of this study, we analyzed data of a local
pharmaceutical company in PA on clinical trials for rare
diseases. Rare diseases are the diseases which affects
only a small proportion of the population. Using analytic
tools, we cleaned the data set to ungroup diseases
from each of the clinical trials, got rid of extra spaces,
treated blank cells, converted numbers stored as text
into numbers, and removed duplicates. We then sorted,
grouped, and ungrouped data pertaining to diseases
and clinical trials. Figure 1 presents top rare diseases
with clinical trial. The top 5 primary conditions for
rare trials were cancer, lymphoma, leukemia, brain
and central nervous system and multiple myeloma.

Clinical trials use various variables such as gender
and age to identify the demographics in various rare
disease clinical trials. We found that successful trials
included all genders (93%) instead of just focusing on
one gender. 63% of the clinical trials had participants
in the older adult age bracket.
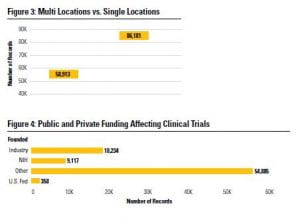
In addition to age and gender, we found that location,
funding sources and intervention method had impacts
on the success of clinical trials. As presented in Figures
3 and 4, we found clinical trials with multi-locations
had greater success rate than trials with single location;
trials with multiple funding sources were more
successful than the private (industry) and single sources
( for instance, US. National Institutes of Health or
other US Federal agencies); and that the intervention
of drugs had the highest trial completion rate than
biological interventions. In summary, based on our
data analysis, the pharmaceutical company was able
to discover which clinical trials had the most success
in terms of funding source, intervention method, age
group enrolled and location.
Our analysis was short compared to the extend that
data analytics can be used in the healthcare industry.
Learning more about the historical data captured can
inform management on how to proceed with future
clinical trials. The insights retrieved from the data allows
decision makers to make intelligent decisions. Moving
forward, analyst can begin to make dashboards with
key performance indicators that can change with live
data, like what we see with Johns Hopkins’ dashboard.
The possibilities are endless.
References
Center for Diseases control and Prevention. (June 29, 2020).
Surveillance and Data Analytics. Retrieved from https://www.cdc.
gov/coronavirus/2019-ncov/php/open-america/surveillance-dataanalytics.
html
Cruickshank S. (April 14, 2020). John Hopkins launches new
U.S. – focused COVID-19 tracking map. Retrieved from https://
hub.jhu.edu/2020/04/14/johns-hopkins-launches-us-coronavirustracking-
map/
Devesa D., Rine J., & Sethuraman V. (September 24,
2018). Applied Clinical Trials. How data and analytics can
improve cinical trial feasibility. Retrieved from https://www.
appliedclinicaltrialsonline.com/view/how-data-and-analytics-canimprove-
clinical-trial-feasibility
HUB. (April 9, 2020). John Hopkins adds new data visualization
tools alongside COVID-19 tracking map. Retrieved from https://
hub.jhu.edu/2020/04/09/data-visualization-covid19-map/
John Hopkins University & Medicine. (2020). Vaccines. Retrieved
from https://coronavirus.jhu.edu/vaccines
Kent J. (March 11, 2020). John Hopkins develop real time dashboard
to track coronavirus. Retrieved from https://healthitanalytics.
com/news/johns-hopkins-develops-real-time-data-dashboard-totrack-
coronavirus
Kent J. (September 4, 2018). FDA sets goals for Big data,
Clinical trials and artificial intelligence. Retrieved from https://
healthitanalytics.com/news/fda-sets-goals-for-big-data-clinicaltrials-
artificial-intelligence
Novikov, S. V. (2020). Data Science and Big Data Technologies
Role in the Digital Economy. TEM Journal, 9(2), 756–762. https://
doi-org.proxy-tu.researchport.umd.edu/10.18421/tem92-44
Marr B. (April 9, 2020). The vital role of big data in fight against
coronavirus. Retrieved from https://www.forbes.com/sites/
bernardmarr/2020/04/09/the-vital-role-of-big-data-in-the-fightagainst-
coronavirus/#2d46f9da3806
Pratt, M. K. (2016, December 7). 10 hottest tech skills for
2017. Retrieved from https://www.computerworld.com/
article/3147427/10-hottest-tech-skills-for-2017.html