

Dylan Vasbinder
President, Towson University Investment Group
Tyler Simonds
Portfolio Manager, Towson University Investment Group
Chris Breen
Vice-President, Towson University Investment Group
The Towson University Investment Group (TUIG) conducted a research survey that asked participating students what five stocks they would invest in if they had $100,000. We then created two hypothetical portfolios based on the top 50 stock votes.
The Survey
Towson University has six colleges: College of Business & Economics (CBE), College of Health Professions (CHP), Jess & Mildred Fisher College of Science & Mathematics (FCSM), College of Liberal Arts (CLA), College of Fine Arts & Communication (COFAC), and College of Education (CE). The survey results from each college will make up two different portfolios: one for CBE students, and one for non-CBE students.
On 10/5/2018 hypothetical portfolios were created via Morningstar to compare key statistics to the S&P 500. Profiles were created to determine whether an aggressive, moderate, or conservative approach was present. Creating two portfolios allows us to show different investment behaviors based on educational background.
Major Holdings
As presented in Table 1, the top five holdings from the 2018 survey account for 55.09% of the CBE portfolio, 68.92% of the Non-CBE portfolio, and 53.25% of the combined portfolio. We see similarities among these portfolios with holdings in Amazon.com (AMZN), Apple Inc. (AAPL), Alphabet (GOOG) and Nike (NKE). Among the top five holdings, the portfolio differences lie in the preference of Tesla (TSLA) for CBE students and Under Armour (UAA) for Non-CBE students.
Table 1: Top 5 Responses
| CBE Holding | % of Votes | Non-CBE Holding | % of Votes | Combined Holding | % of Votes |
| AMZN | 13.95% | Cash | 34.78% | Cash | 24.10% |
| Cash | 13.95% | AAPL | 11.59% | AAPL | 10.50% |
| AAPL | 12.17% | AMZN | 6.92% | AMZN | 8.45% |
| GOOG | 6.23% | GOOG | 6.06% | GOOG | 5.44% |
| TSLA | 5.04% | NKE | 5.88% | NKE | 4.76% |
| Total | 51.34% | Total | 65.22% | Total | 53.25% |
It is worth noting that the average student response time was only 1 minute and 49 seconds, while in reality one would do extensive research before investing. Warren Buffet once explains that, “In the short term, the market is a popularity contest. In the long term, the market is a weighing machine.” The short response time can suggest either prior research or a recency bias.
In 2017’s survey the top five holdings were AMZN (11.9%), APPL (10.1%), GOOG (8.8%), MSFT (Microsoft Corp. 7.7%), and UAA (6.0%). Two major changes from 2017 are UAA and MSFT: UAA did not make the CBE top 5 (1.0%) and MSFT did not make either top 5 holding lists (2.35% of CBE and 1.67% of Non-CBE). In 2016 the top five holdings were Twitter Inc. (8.3%), Under Armour Inc. (6.7%), Apple Inc. (6.4%), Yahoo (6.3%), and Facebook, Inc. (6.2%).
Sector Allocations & Performance
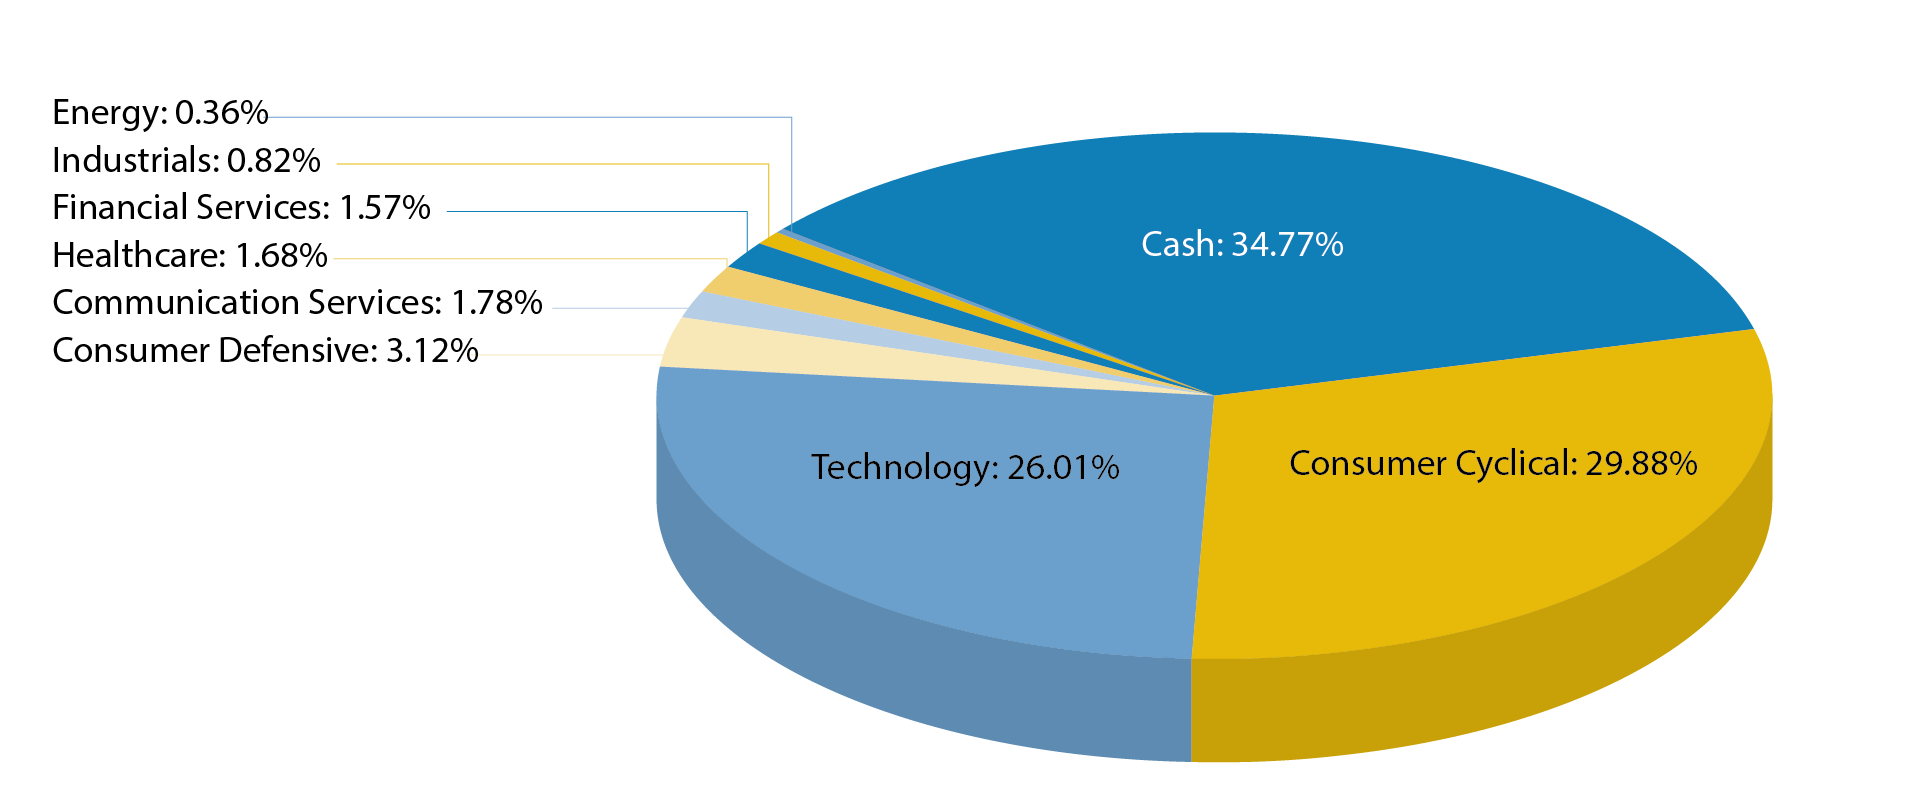
Figures 1 and 2 represent sector allocations from each portfolio. Among Towson University students we find favorability in Consumer Cyclical, and Technology, and unfavorability in Utilities, Communications Services, and Basic Materials sectors. Consumer cyclical and technology stock allocations decreased from 85% in 2016, to 76% in 2017, and now a combined average of about 64% in 2018. The increase in diversification is a good sign regarding students’ company exposure. We believe that the large portions of cash allocations are attributable to investment disinterest, erroneous results, or lack of knowledge from the posed survey question.
Figure 1: 2018 Sector Allocation of CBE Students Survey Portfolio
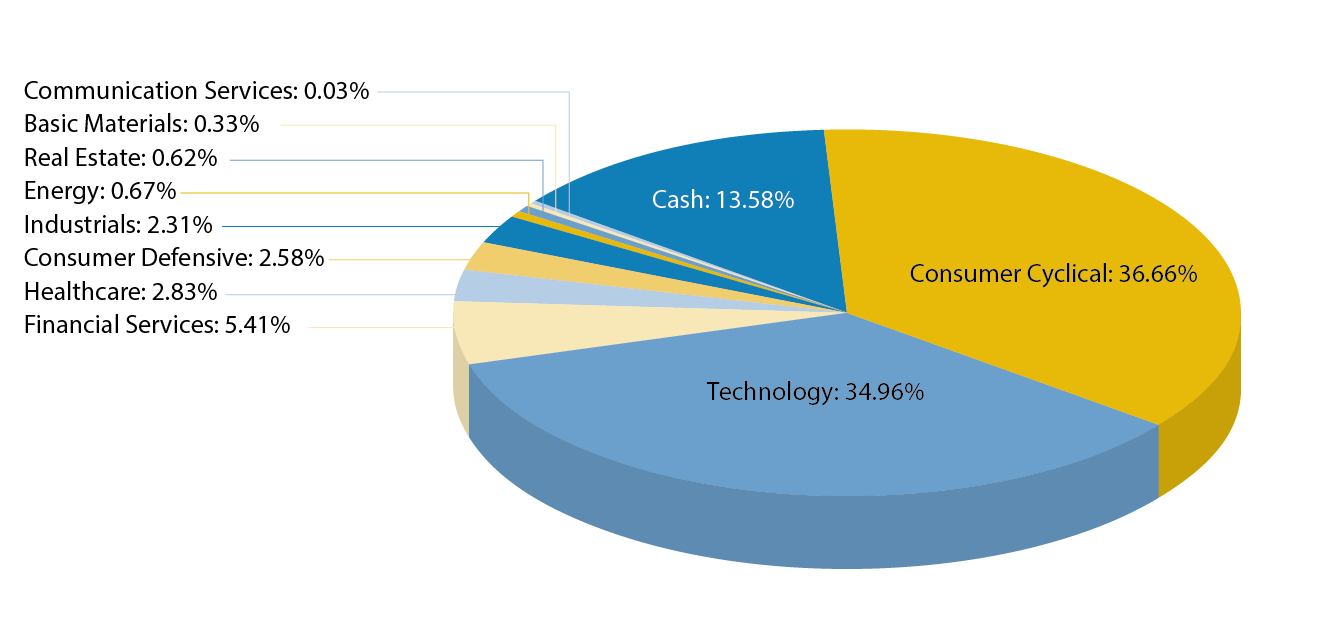
Figure 2: 2018 Sector Allocation of Non-CBE Students Survey Portfolio
Portfolio Metrics
Table 2 illustrates portfolio characteristics compared to the S&P 500. Attributable to the large weighting of information technology stocks, both student portfolios have higher market capitalization and higher P/E, however with lower dividend yields. Table 2 also provides insight to the respective approaches in each portfolio and suggests that both portfolios focus towards aggressive growth stocks. Both student portfolios are overweight in cyclical and speculative growth stock types. This subjects student portfolios to an increase in individual stock risk than the S&P 500.
Table 2: Portfolio Characteristics and Stock Type Comparison
| Non-CBE | CBE | S&P 500 | |
| Price/Prospective Earnings | 22.1 | 23.79 | 18.02 |
| Price/Book Ratio | 6.15 | 5.92 | 3.15 |
| Return on Assets (ROA) | 8.23% | 7.25% | 7.98% |
| Return on Equity (ROE) | 23.09% | 15.26% | 23.12% |
| Projected EPS Growth – 5 yr% | 17.44% | 20.26% | 12.28% |
| Dividend Yield | 0.60% | 0.68% | 1.62% |
| Average Market Cap (Millions) | $200,840 | $201,872 | $109,713 |
| % of High Yield | 1.97% | 1.85% | 3.64% |
| % of Hard Asset | 0.58% | 1.55% | 7.47% |
| % of Cyclical | 62.64% | 65.09% | 44.13% |
| % of Slow Growth | 6.45% | 3.53% | 17.54% |
| % of Classic Growth | 9.04% | 6.84% | 11.26% |
| % of Aggressive Growth | 6.13% | 9.40% | 6.88% |
| % of Speculative Growth | 11.54% | 10.29% | 5.13% |
Observations
We deem survey votes to represent investment interest in company stock and utilize them to illustrate popular trends and company presence among Towson University students. Table 1 reports top five holdings among all Towson students, whereas Tesla (2.72%), Facebook (2.33%), Disney (2.24%), Under Armor (2.24%), Microsoft (1.75%) and Netflix (1.75%) ranked sixth to tenth, respectively.
Facebook, once a top holding in 2016, is an unfavorable social media platform among Towson University students. Volatility from the 2017 election allegations with Cambridge Analytica concerns students with issues of privacy and cyber security. Google, Amazon, and Apple face similar issues, but students favor these companies due to the heavy integration with research, shopping, and communication. YTD, Amazon shares are up 53.32%, Apple shares are up 31.70%, Google shares are up 7.33%, while Facebook shares are down 12.96%.
Last year Tesla received 32 votes in 2017, which has decreased to 28 this year. Even though Tesla shares are down 18.01% YTD, many students still favor this company for its innovative technology. It will be interesting if Musk can build a team for Tesla, as production pressures loom over backorders. Utilizing delegation could help drive more of his innovation and visionary efforts towards SpaceX.
Tilray and Canopy Growth retained a total of 11 votes, which is a 55% growth in marijuana industry interest among Towson University students. While there were only 10 dispensaries positioned to open in Maryland last year, there are now 34 open and 102 approved dispensaries in the state. It is eminent that the industry is beginning to look brighter, as Tilray became the first company to export legal marijuana into the US for clinical trials to treat essential tremors at the University of California at San Diego. Canopy Growth was the largest publicly traded marijuana company, but recently became dethroned by Tilray. From its IPO in June, shares of Tilray have grown over 475%.
Performance
Table 3 presents the two-year hypothetical growth of $10,000 invested in the S&P 500 Index, and the TU Survey Portfolio from October 2016 to October 2018. The TU Survey Portfolio is reallocated every year based on most recent survey results.
Table 3 Portfolio Performance
| TU Survey Portfolio | S&P 500 | |
| 10/31/2016 | $10,000.00 | $10,000.00 |
| 10/31/2017 | $11,516.81 | $12,112.32 |
| 10/10/2018 | $14,281.03 | $13,547.20 |
As we can see, the TU Survey Portfolio outperformed the S&P 500 Index in 2018. This is a result of high performances in top allocations through October 10, 2018. Stellar performances of Twitter (+9.30%), NFLX (+62.08%), APPL (+25.60%), and AMZN (+47.62%) weighed in on outperforming the benchmark. Their weights are 11.67%, 7.52%, 6.99%, 6.72% respectively. These top performers overshadowed losses from AABA (-20.13%), FB (-16.56%), SBUX (2.81%), and WMT (-2.87). Their weights are 7.09%, 4.96%, 4.39%, and 2.17% respectively.
CBE vs Non-CBE Confidence
As a part of our survey we asked participants to rate their confidence on a scale from 1 – 5: 1 being least confident and 5 being most confident. We then measure the averages, rank colleges from least to most confident [Disclosure]. Based on our analysis, we find that CBE students ranked highest (2.92) and College of Education students ranked lowest (1.36) in their hypothetical investment decisions. We see a correlation in that lower confidence levels result in higher cash allocations.
President Trump recently replaced NAFTA with the USMCA (United States- Mexico- Canada- Agreement), and is now focusing his efforts towards ending the China trade skirmish. Tariffs are weighing in on billions of dollars worth of goods and raw materials. We anticipate the impact on domestic supply chain management characterizes the favoritism in tech stocks, and also the uncertainty and risk-aversion (which is what we believe to be represented by the large allocation to cash) among TU students.
Conclusion
Our survey resulted in a total of 206 responses from Towson University Students. Among the two portfolios, students generally had similar sector weightings, but no school posted an above average confidence level. Our economic indicators suggest that the U.S. may be approaching a changing point in the business cycle. We believe this indicates the higher risk-aversion among students. Additionally, student confidence levels could suggest that a lack of financial knowledge may inhibit response accuracy. Through evaluating macroeconomic indicators, tallying stock votes, aggregating portfolios, and analyzing results we find evidence to suggest that students trend towards familiarity, but lack confidence in making investment decisions.
Through our tenure as TUIG executives we have seen first hand that financial literacy is lacking in many young Americans. Institutions, specifically primary and secondary schools, are taking action by outsourcing the task of teaching financial literacy. One example is Ortus Academy, a Baltimore based nonprofit organization, which teaches financial literacy through a simulation based game. Members of TUIG volunteer with Ortus Academy annually, because we believe that programs like this will lead future generations to becoming more financially literate.
References
- Baltimore Sun. (n.d.). Medical Marijuana Dispensaries Open. Retrieved from https://www.baltimoresun.com/business/bs-bz-medical-marijuana-%20Dispensaries-open-20180319-story.html
- Bureau of Labor Statistics. (n.d.). Graph: Unemployment rate (seasonally adjusted). Retrieved from https://data.bls.gov/pdq/SurveyOutputServlet?request_action=wh&graph_name=LN_cpsbref3
- CNBC. (2017, November 13). US10Y: U.S. 10 Year Treasury – Stock Quote and News. Retrieved from https://www.cnbc.com/quotes/?symbol=US10Y
- Elkins, K. (2017, October 03). Here’s how many millennials are actually saving for retirement. Retrieved from https://www.cnbc.com/2017/10/03/how-many-millennials-are-saving-for-retirement.html
TUIG Disclosure:
The average confidence level of all TU students is 2.38, with an average of 2.92 for CBE students and 2.09 for non-CBE students. Averages for students in other colleges are: FMS (2.37), FA (2.26), HP (2.22), LA (1.82), and EDU (1.36).
About TUIG
TUIG is a student run organization that was created as a forum for highly driven, like minded students to gain real-world experience through quantitative and qualitative research. We offer students a professional environment to discuss, learn, and connect with real-world financial experiences. TUIG maintains professional relationships with a widespread network of integrated local Maryland businesses in order to provide members with the opportunity to create interpersonal relationships with mentors and potential future employers.