

Lijing Du, Ph.D.
Assistant Professor, Department of Finance, Towson University
Jian Huang, Ph.D.
Assistant Professor, Department of Finance, Towson University
Adam Macek
President, Towson University Financial Management Association
Annaliese Winton
Major in Financial Economics, Towson University
An Initial Public Offering (IPO) is one of the most consequential events in the life of a company. An IPO creates liquidity for the firm’s shares, provides an infusion of capital to fund growth, and provides cheaper and ongoing access to capital (Celikyurt, Sevilir, and Shivdasani, 2010). Maryland, with its location advantage, has been making good use of IPOs in funding its rapid economic growth, especially its growth in the high tech area. This article aims to provide an overview of the time/industry distribution of Maryland IPOs, and the crucial role they play in Maryland’s economy.
Time Distribution of Maryland IPOs
Maryland IPOs trend with the overall country’s economy by correlating with business cycles and adjusting to the availability of funds and financing options. Table 1 reports number, proceeds, firm size and firm age of Maryland IPOs from 1980 to 2010. The number of Maryland IPOs peaked in 1986, with 22 firms going public. In the 90s, a time that tech companies were fueling the stock market, the number of IPOs remained steady, with the highest number of 16 IPOs in the year of 1996. The market quickly changed in 2001, once the tech bubble burst and stock values depleted. In 2001 there was only one IPO, and not a single one in 2002. Similarly, during the recent financial crisis, there were two IPOs in 2008 and only one in 2009, followed by 5 in 2010 as the economy began to recover.
Figure 1 plots the number of Maryland IPOs and proceeds raised by year. As expected, Figure 1 indicates a positive correlation between the number of Maryland IPOs and the total proceeds raised by all firms every year. The largest Maryland IPO was USEC Inc. in 1998, which generated total proceeds of 1759.38 million dollars ($2010).
Figure 1: Time Distribution of Maryland IPOs
Maryland IPOs in the 1990s: The Role of High Tech Firms
As indicated in Table 1 and Figure 1, Maryland had more IPOs in the 90s than any other decade examined, and more than twice as many firms went public in the 90’s (84) than in the 2000’s (38). IPOs in the 1990’s were comprised of significantly smaller companies than the previous and post decades. The average firm size was 2/3 smaller than that of companies from either the 80’s or 2000’s. The largest firm of the entire sample, Commercial Credit Company, was approximately $9.6 billion in 1986, greatly surpassing the largest firm from the 90’s of only about $3.1 billion.
Table 1. Maryland IPOs during 1980-2010
| IPO Year | # MD IPOs | IPO Proceeds raised by all fimrs | Average Proceeds per Fiorms | Average Firm Size at the Time of IPO* | Average Firm Age at the Time of IPO |
| 1980 | 1 | 29.11 | 29.11 | N/A | 6.00 |
| 1981 | 11 | 97.67 | 8.88 | N/A | 13.00 |
| 1982 | 4 | 84.56 | 21.14 | N/A | 7.00 |
| 1983 | 9 | 470.30 | 52.26 | 197.26 | 8.00 |
| 1984 | 6 | 222.63 | 37.10 | N/A | 46.25 |
| 1985 | 4 | 70.32 | 17.58 | 34.18 | 32.25 |
| 1986 | 22 | 2,411.83 | 109.63 | 645.00 | 28.67 |
| 1987 | 9 | 317.45 | 35.27 | 449.82 | 29.75 |
| 1988 | 7 | 471.25 | 67.32 | 4.73 | 17.00 |
| 1989 | 1 | 105.23 | 105.23 | 442.79 | N/A |
| 1980-1989 | 74 | 4,280.35 | 57.84 | 442.62 | 24.02 |
| 1990 | 2 | 85.16 | 42.58 | 23.19 | 22.00 |
| 1991 | 5 | 290.52 | 58.10 | 60.12 | 9.60 |
| 1992 | 4 | 246.19 | 61.55 | 6.45 | 6.50 |
| 1993 | 12 | 1,474.53 | 122.88 | 128.02 | 9.25 |
| 1994 | 12 | 1,000.80 | 83.40 | 140.78 | 17.22 |
| 1995 | 7 | 393.16 | 56.17 | 187.39 | 10.43 |
| 1996 | 16 | 989.50 | 61.84 | 91.35 | 7.33 |
| 1997 | 10 | 713.02 | 71.30 | 33.50 | 11.56 |
| 1998 | 8 | 2,488.36 | 311.05 | 453.75 | 11.00 |
| 1999 | 8 | 1,040.83 | 130.10 | 124.34 | 5.50 |
| 1990-1999 | 84 | 8,722.08 | 103.83 | 144.45 | 10.31 |
| 2000 | 9 | 2,668.26 | 296.47 | 585.04 | 8.89 |
| 2001 | 1 | 24.63 | 24.63 | 11.45 | 5.00 |
| 2002 | 0 | 0.00 | N/A | N/A | N/A |
| 2003 | 3 | 607.04 | 202.35 | 548.50 | 3.50 |
| 2004 | 2 | 831.63 | 415.81 | 1,045.84 | 15.00 |
| 2005 | 6 | 1,200.79 | 200.13 | 602.63 | 19.40 |
| 2006 | 6 | 448.57 | 74.76 | 80.18 | 7.17 |
| 2007 | 3 | 205.78 | 68.59 | 110.58 | 8.50 |
| 2008 | 2 | 595.65 | 297.82 | 886.69 | 13.00 |
| 2009 | 1 | 409.10 | 409.10 | N/A | 0.00 |
| 2010 | 5 | 472.35 | 94.47 | 224.83 | 22.00 |
| 2000-2010 | 38 | 7,463.80 | 196.42 | 439.86 | 11.52 |
| Full Sample | 196 | 20,466.23 | 104.42 | 300.59 | 15.10 |
| *$ million in 2010 dollars | |||||
In addition to being smaller, IPO firms in the 90’s were also younger companies, having the youngest average firm age of all decades at only 10 years old, a drastic decrease from 24 years in the previous decade. In fact, some firms that went public in the 90’s were not even a year old, an occurrence that didn’t happen at all in the 80’s and not again until 2009.
These characteristics coincide with the fact that tech companies require fewer assets and employees than other industries, allowing smaller, younger, and additional companies the opportunity to go public, especially around the time of the tech bubble. Whether firms needed financing, or saw an opportunity of growth in the tech industry on a national and even global level, many of the Maryland companies that went public in the 90’s were from the tech sector.
Maryland IPOs in the 2000s: When Alternatives Funds Were Available for High Tech
In the decade of 2000s, there were only 38 IPOs, a substantial drop from 84 IPOs in the 90’s. Could this drastic decrease be due in part to more financing options becoming available for smaller firms, especially tech? In recent years, Maryland has implemented programs and incentives to assist tech firms. “Aiding the state’s growth is the InvestMaryland Program, which added $84 million to Maryland’s high-tech base during Fiscal Year 2012, and is overseen by the Maryland Venture Fund Authority” (Maryland State Archives, 2017). In addition, there are potential tax refunds for tech companies, such as the Maryland Cybersecurity Investment Incentive Tax Credit, or CIITC, which “provides a refundable income tax credit to Qualified Maryland Cybersecurity Companies (QMCCs) that secure investment from investors. The purpose of this new program is to incentivize and attract cybersecurity companies to startup in or move to Maryland; and to attract investment to cybersecurity companies in order to help them grow, create jobs and retain intellectual property in Maryland (Maryland Department of Commerce)”. These programs are just two examples of new financing incentives to help tech companies in Maryland grow and to bring tech companies from other states into Maryland, which we have already seen happen with Luminal. Luminal is a cybersecurity firm that relocated from West Virginia to Frederick and was awarded $600,000 through the InvestMaryland Program. It was also one of the first companies to apply for the cybersecurity tax credit (MDBIZ News).
Maryland IPOs versus IPOs from the Other States
Table 2 presents a comparison of Maryland IPOs with IPOs in other states. Looking at IPOs across the U.S., Maryland-based firms were smaller, younger, and more likely to be in the high-tech industries compared to other states. Maryland’s average firm size at the time of IPO was $143.5 million less than the average firm size of other states. Consequently, other states had higher average IPO proceeds, approximately $24 million more than Maryland proceeds. This overall picture coincides with the observation of smaller companies being tech-related, especially for Maryland IPOs in the 90s. Most strikingly, high-tech firms accounted for more than half of Maryland IPOs, which was 12% more high-tech IPOs than in other states.
Industry Distribution of Maryland IPOs
As more than half of Maryland IPOs are in the high tech industry, we take a finer look into the industry distribution. A high-tech industry was defined as the one that has greater than the national average of engineers, engineering technicians, computer scientists, mathematicians, and life scientists (Glasmeier, 2017). According to our data on high-tech firms in Maryland, the three largest high-tech industries are services, healthcare, and business equipment, respectively.
Figure 2 shows that healthcare, finance, and services account for the largest distribution of Maryland IPO’s by industry. It is important to note that the finance industry is not included as high-tech firms. Specifically, of the 99 firms defined as high-tech Maryland IPO’s, 38% are in the services industry, 28% are in healthcare, and 19% are in business equipment to name the largest. Even though the finance industry is not included as high-tech, this industry does use several high tech resources. These major industries are constantly adapting and utilizing technological advances, so it’s logical that they are classified as high-tech. In the healthcare industry, technology ranges all the way from biotechnology to apps that allow doctors to speak directly into devices, and IT services such as computer programming and systems design make up part of the service industry.
Figure 2: Industry Distribution of Maryland IPOs
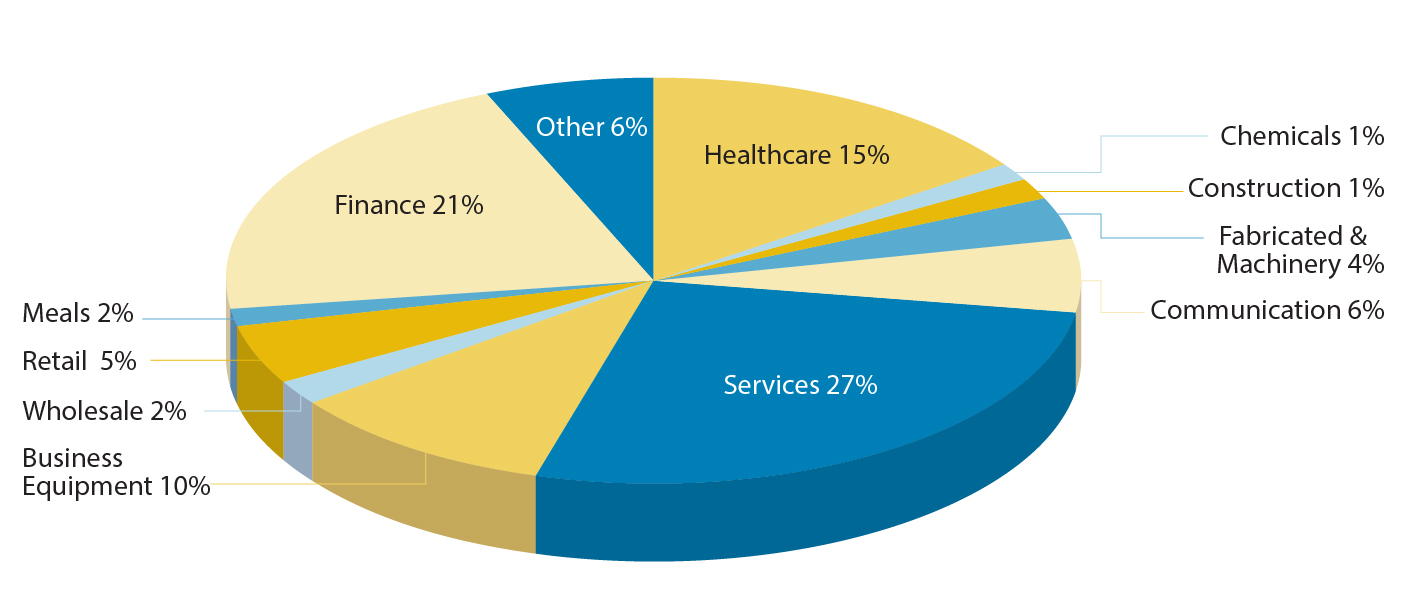
Table 2. Comparison of Maryland IPOs and IPOs Headquartered
in the Other U.S. States
| Issuance Characteristics | Maryland IPOs | Other States’ IPOs | 2-Sample t-statistic |
| IPO Proceeds (inlcuding overallotment; $million in 2010 dollars) | 104.40 | 129.00 | 1.61 |
| IPO Shares (including overallotment) | 5.24 | 7.06 | 2.85*** |
| IPO Float | 5.37 | 7.23 | 2.82*** |
| Offer Price | 14.09 | 16.44 | 0.86 |
| Closing Price of First Trading Day | 13.68 | 13.62 | 0.07 |
| Underpricing | 18.41 | 18.19 | 0.9517 |
| Shares Outstanding | 13.31 | 23.18 | 6.19*** |
| Number of Underwriters | 2.48 | 2.81 | 2.67*** |
| Firm Characteristics | |||
| Venture Capital-Backed | 35.20% | 27.07% | 2.36** |
| High-Tech Firms | 50.51% | 38.67% | 3.28*** |
| Number of Analysts Following the IPO Firm | 0.38 | 0.34 | 1.3 |
| Firm Age at the Time of IPO | 15.10 | 15.52 | 0.25 |
| Firm Size at the Time of IPO ($million in 2010 dollars) | 300.60 | 444.10 | 1.66* |
Conclusion
To conclude, Maryland IPOs trended with the national economy, and were mostly made up of high-tech companies, with services, healthcare, and business equipment as the three leading high-tech industries. Maryland also took part in the tech bubble of the late 90’s by going public with smaller, younger companies. With the significant proportion and role of high tech in Maryland, innovative programs and incentives have been put into place by the Maryland government to support the growth of local tech firms, and to bring tech firms from other states into Maryland.
References
Celikyurt, U., Sevilir, M., and Shivdasani, A. (2010). Going Public to Acquire? The Acquisition Motive in IPOs. Journal of Financial Economics. 96(3). 345-363
Csorny, L. (2013). Careers in the Growing Field of Information Technology Services. U.S. Bureau of Labor Statistics. Retrieved from https://www.bls.gov/opub/btn/volume-2/careers-in-growing-field-of-information-technology-services.htm
Glasmeier, A.K. (2017). The High-Tech Potential. Routledge.
Maryland Department of Commerce. (2017). Cybersecurity Investment Incentive Tax Credit (CIITC). Retrieved from http://commerce.maryland.gov/fund/programs-for-businesses/cyber-tax-credit.
Maryland State Archives. (2017). Maryland at a Glance. Retrieved from http://msa.maryland.gov/msa/mdmanual/01glance/economy/html/economy.html
MDBIZ News. (2014). Maryland Invests $600K IN Cybersecurity Startup Luminal. Retrieved from https://mdbiznews.commerce.maryland.gov/2014/04/maryland-invests-600k-in-cybersecurity-startup-luminal