A paper with two USGS colleagues that is based on work that I did during my sabbatical (in 2018-19) was just accepted is now published at Environmental Science & Technology. I am really excited about this paper, which includes nearly 30 million observations, and is the broadest published study to date to quantify exceedances of the EPA aquatic life criteria for chloride.
High-frequency data reveal deicing salts drive elevated specific conductance and chloride along with pervasive and frequent exceedances of the U.S. Environmental Protection Agency aquatic life criteria for chloride in urban streams.
Moore J., Fanelli R. M., Sekellick A. J. (2020)
Environmental Science & Technology. 54: 778-789.
https://doi.org/10.1021/acs.est.9b04316
The data are visually summarized in a clickable map.
Abstract:
Increasing specific conductance (SC) and chloride concentrations [Cl] negatively affect many stream ecosystems. We characterized spatial variability in SC, [Cl], and exceedances of EPA [Cl] criteria using nearly 30 million high-frequency observations (2- to 15-minute intervals) for SC and modeled [Cl] from 93 sites across three regions in the eastern United States: Southeast, Mid-Atlantic, and New England. SC and [Cl] increase substantially from south to north and within regions with impervious surface cover (ISC). In the Southeast, [Cl] weakly correlates with ISC, no [Cl] exceedances occur, and [Cl] concentrations are constant with time. In the Mid-Atlantic and New England, [Cl] and [Cl] exceedances strongly correlate with ISC. [Cl] criteria are frequently exceeded at sites with greater than 9–10% ISC and median [Cl] higher than 30–80 mg/L. Tens to hundreds of [Cl] exceedances observed annually at most of these sites help explain previous research where stream ecosystems showed changes at (primarily non-winter) [Cl] as low as 30–40 mg/L. Mid-Atlantic chronic [Cl] exceedances occur primarily in December–March. In New England, exceedances are common in non-winter months. [Cl] is increasing at nearly all Mid-Atlantic and New England sites with the largest increases at sites with higher [Cl].
Related work:
USGS data release
Fanelli, Sekellick, and Moore (2019) Discrete and high-frequency chloride (Cl) and specific conductance (SC) data sets and Cl-SC regression equations used for analysis of 93 USGS water quality monitoring stations in the eastern United States
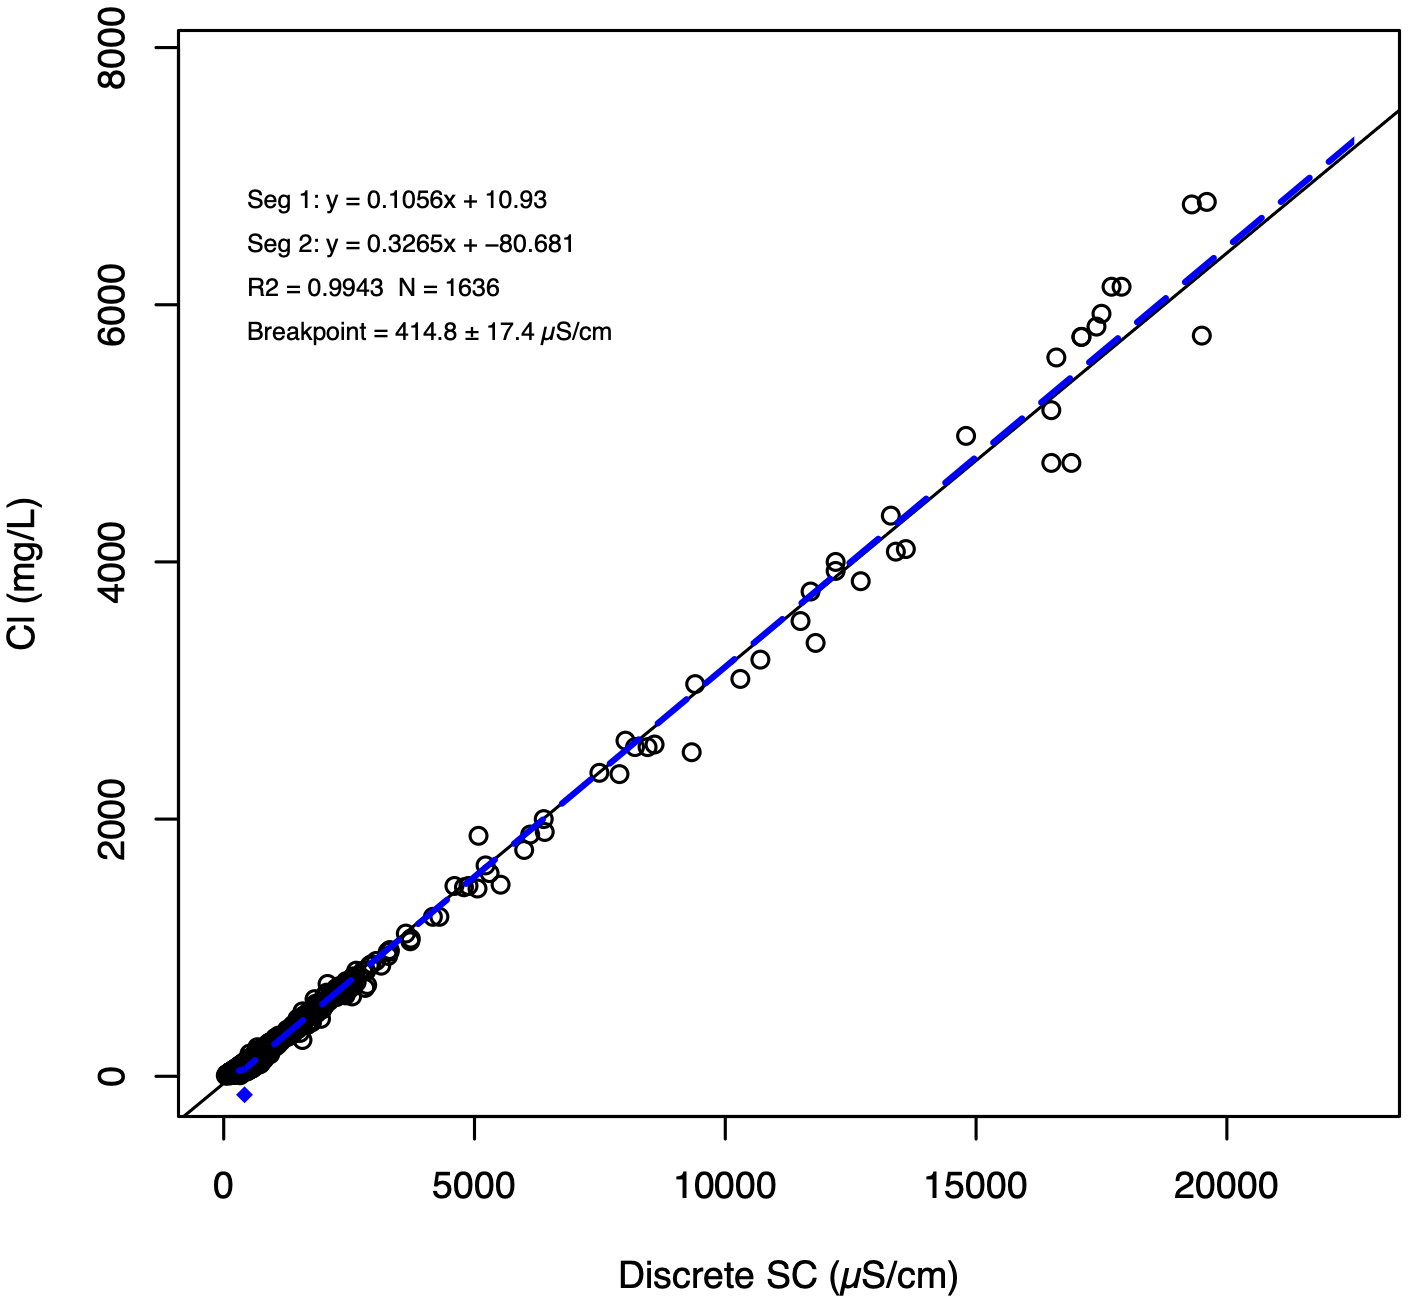
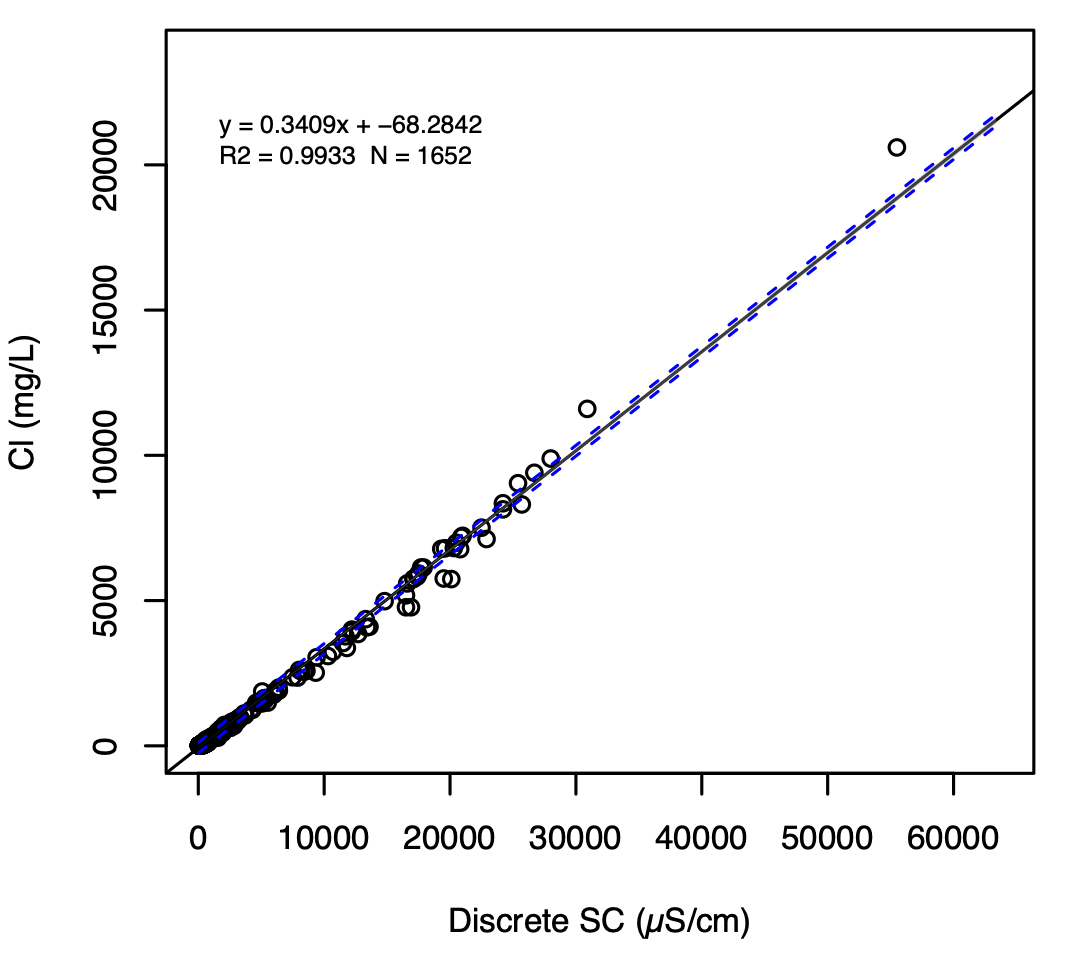
Updated 01/26/2021: This paper is now open access and thus freely available to all. Also, I added the plots for the regional chloride versus specific conductance relationships (with linear regression results also found in Table S10 of Supporting Information) below.
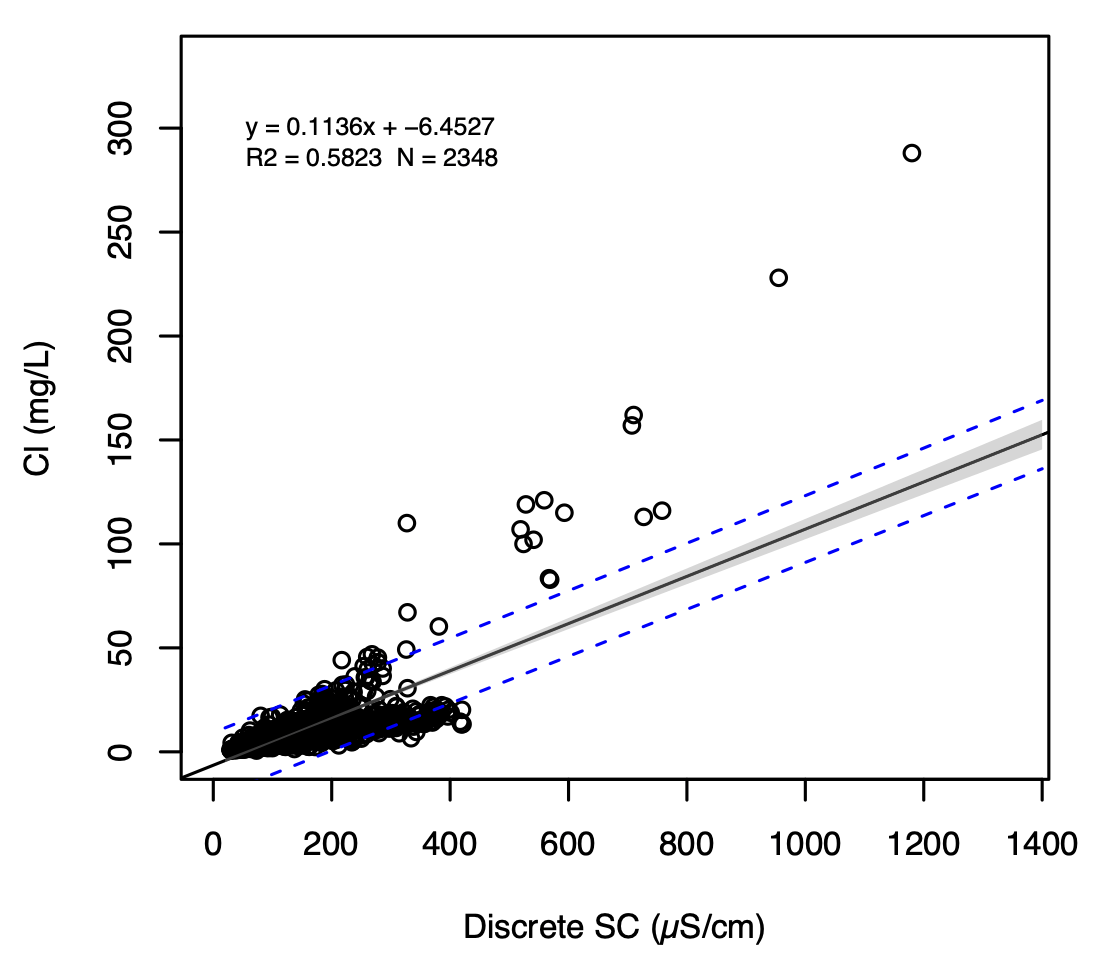
Southeast
1) Single linear regression
2) Piecewise regression

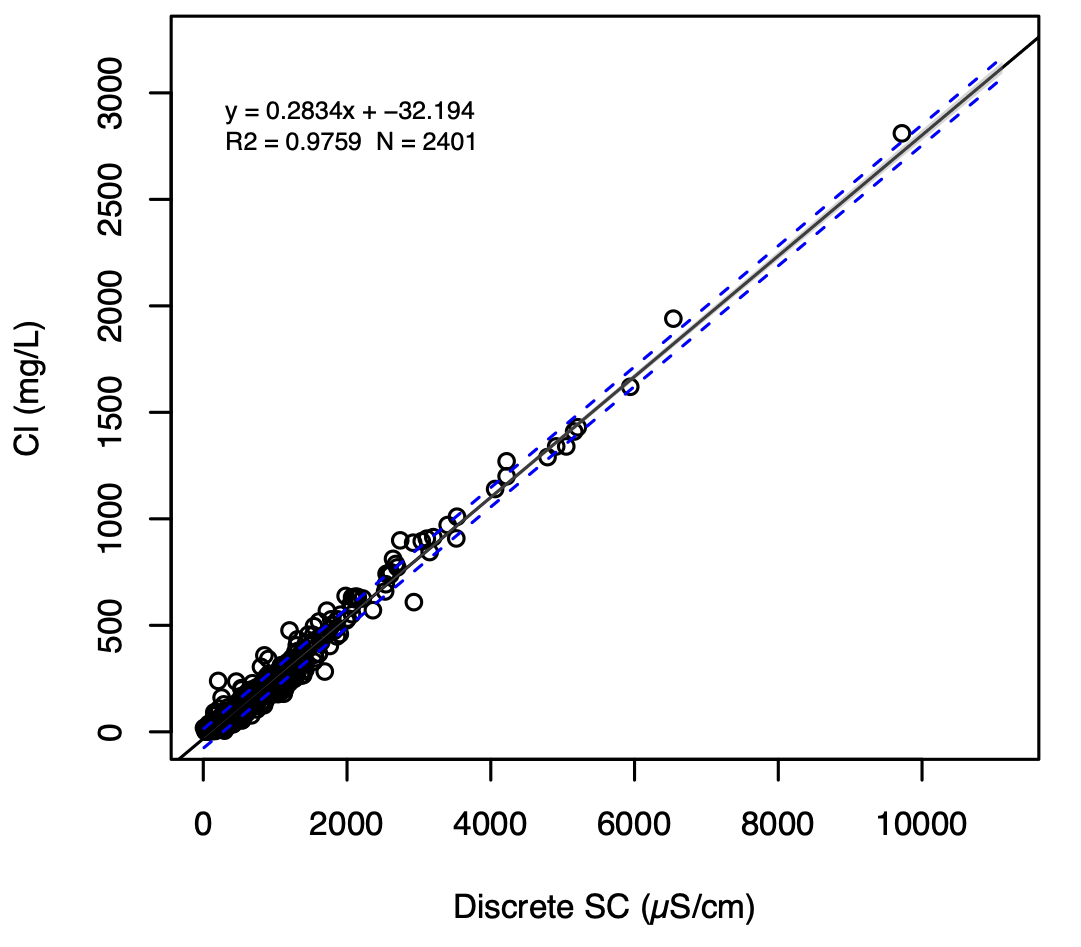
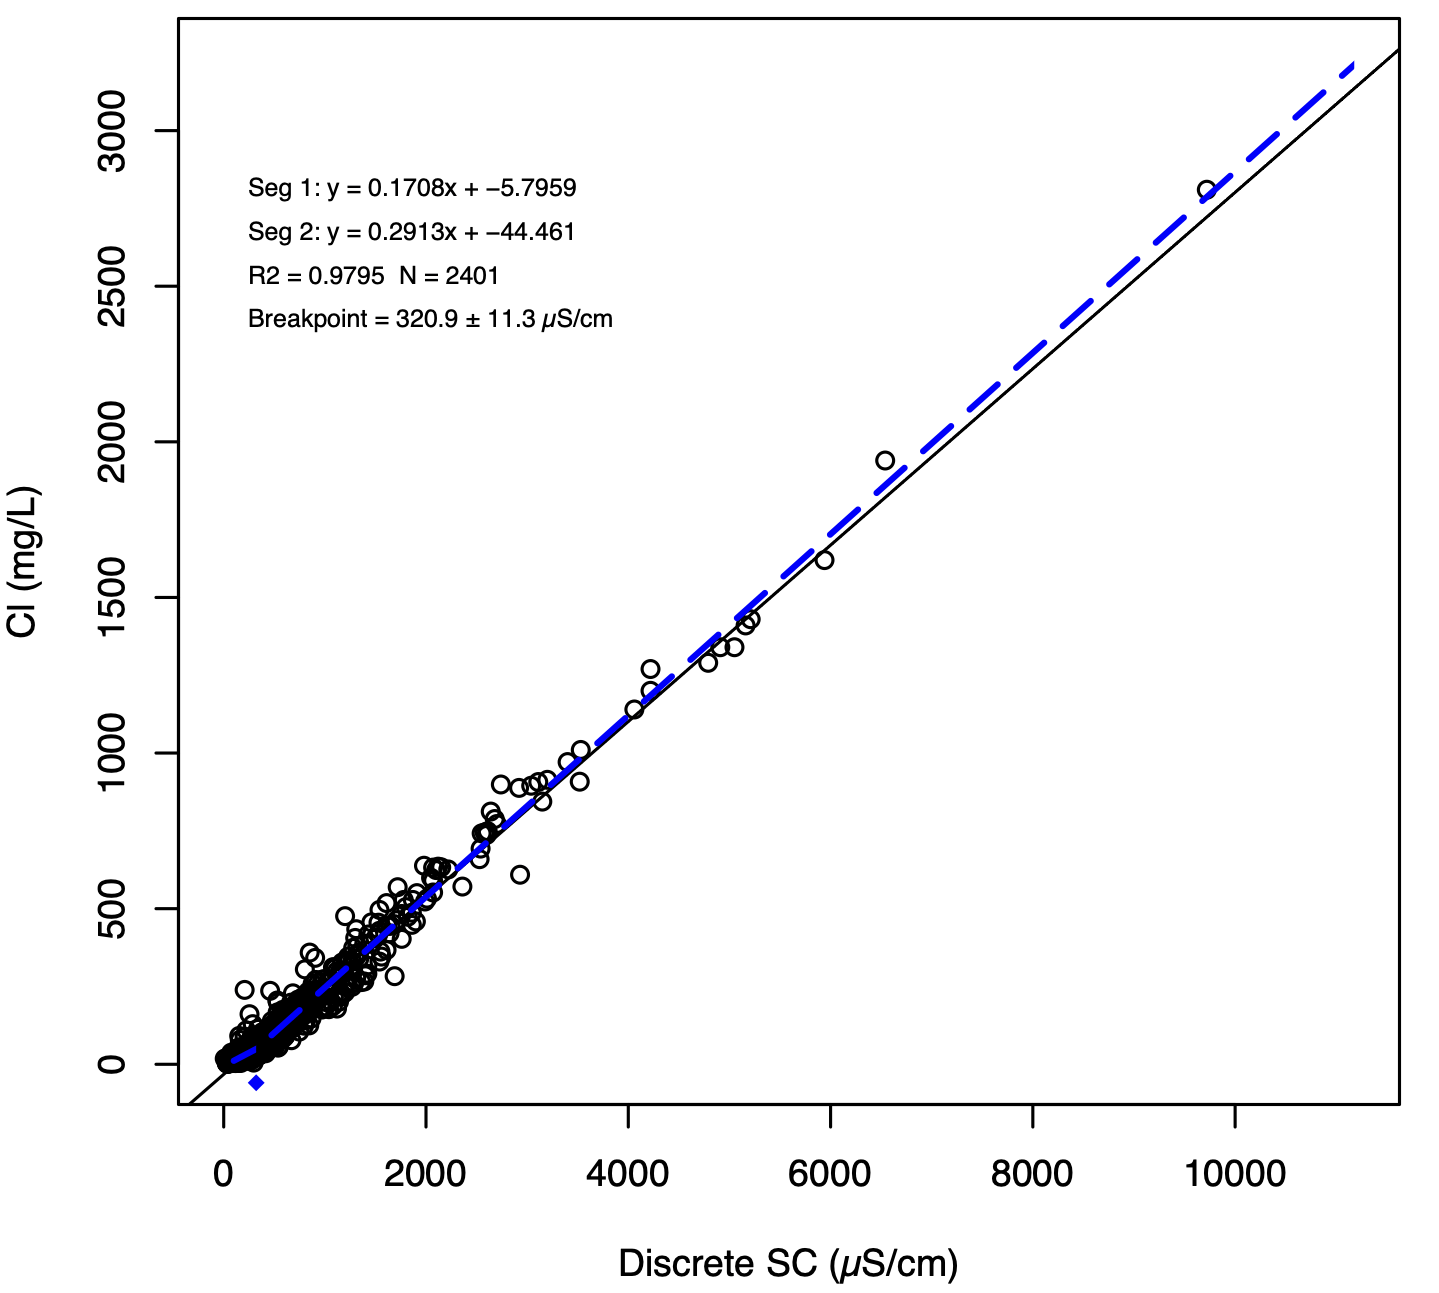
Mid-Atlantic
1) Single linear regression
2) Piecewise regression
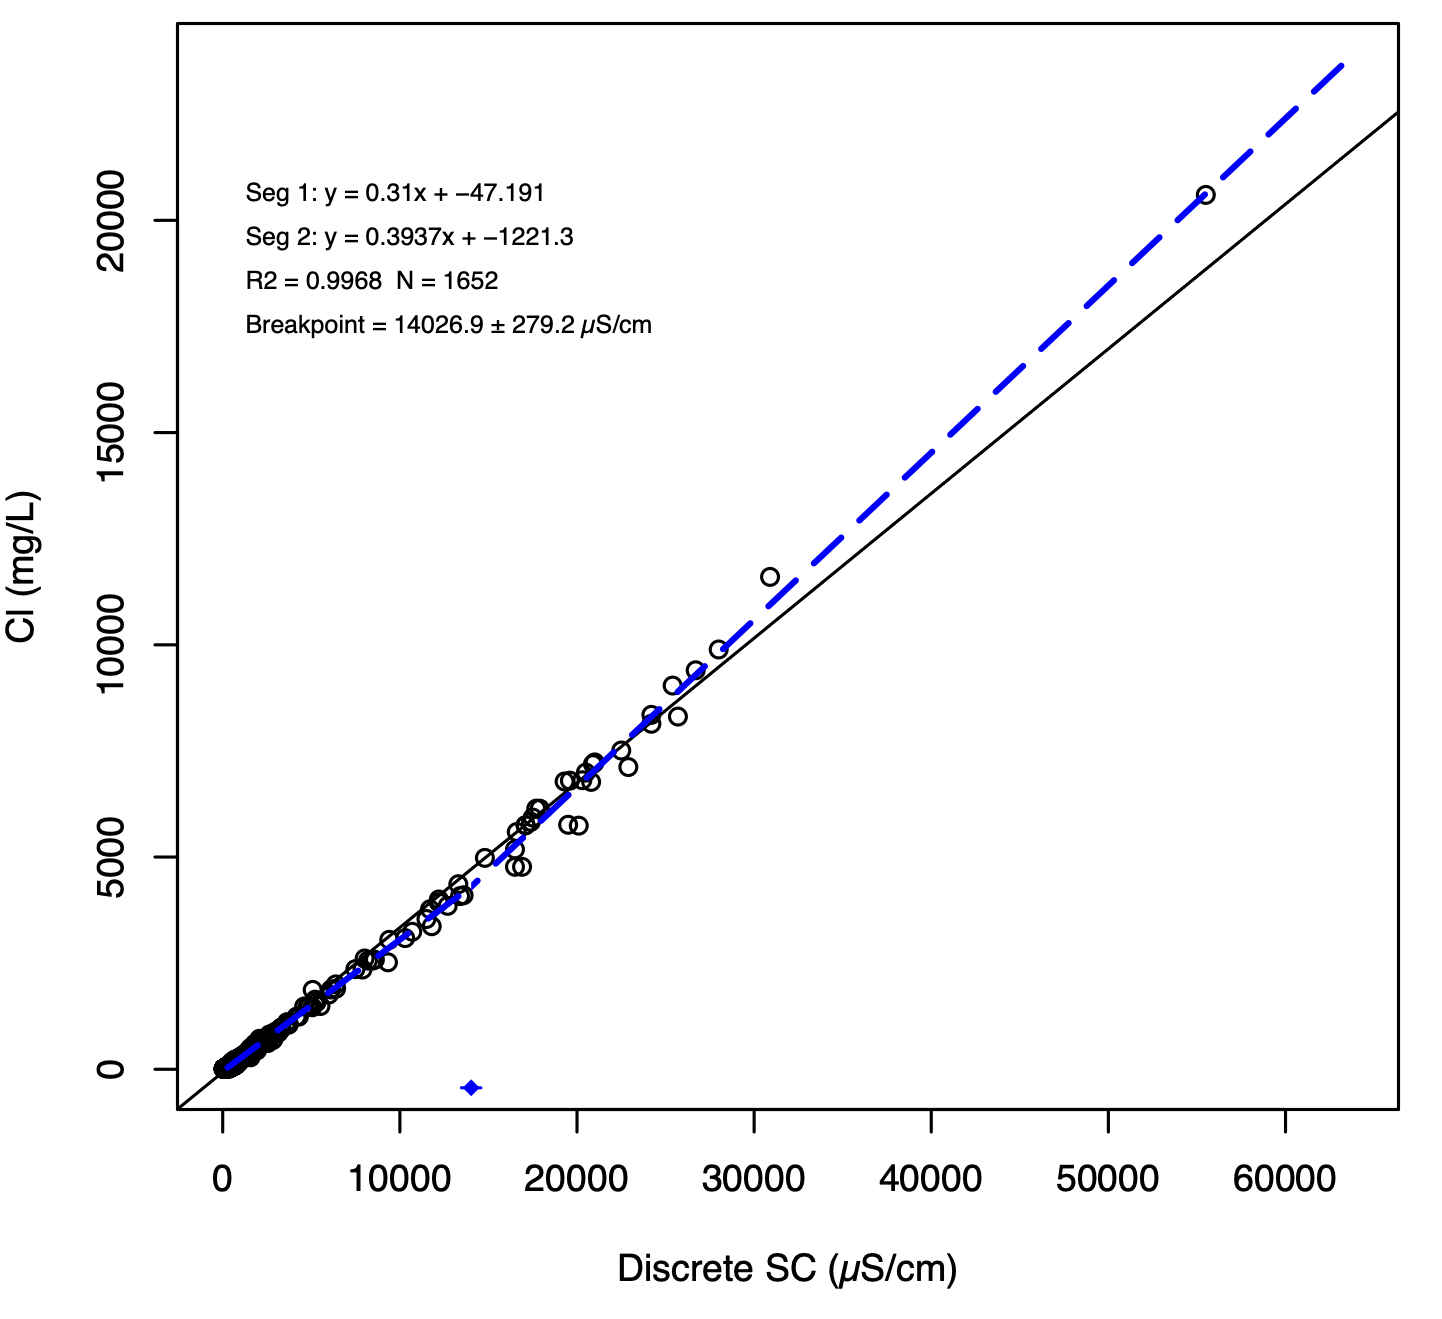
New England
1) Single linear regression – includes only data with SC <20,000 µS/cm

2) Piecewise regression – includes only data with SC <20,000 µS/cm
3) Single linear regression – includes all data
4) Piecewise regression – includes all data