Message from the President

Dear Colleagues and Friends,Zachary Reichenbach

It gives me great pleasure to share with you the eleventh edition of the Baltimore Business Review.  This publication represents a critical partnership between the business and academic communities in Baltimore and its surrounding metropolitan areas.  CFA Society Baltimore is incredibility fortunate to have a great partnership with the Towson College of Business and Economics to make this world-class publication possible.

This publication would not be possible with the help and support of our publication team.  I want to thank the editorial staff of Farhan Mustafa, CFA, from CFA Society Baltimore and Jian Huang and Lijing Du from Towson University.  I want to also think the many contributors to this year’s edition and to Rick Pallansch and Chris Komisar from the Towson University Creative Services team.  Your time and efforts are incredibly valuable.

The CFA Society Baltimore originated in 1948 and currently serves over 750 members today.  In a joint effort, the CFA Society Baltimore and its parent company, the CFA Institute, work to promote and advocate the principles of the CFA program.  The society proudly leads the investment community and other finance related communities by promoting the highest standard of ethics, education, and professional excellence for the benefits of the entire community.  In this publication, you can see the list of the top ten employers of our society’s members.

In recent years, the CFA Baltimore Society has made concerted efforts to expand its outreach beyond the investment community.  Our vision for the society is to expand membership into other accounting and related finance professionals, including but not limited to, financial advisors, registered investment advisors, accountants, lawyers and actuaries.  Membership to the CFA Society Baltimore is open to all professionals dedicated to these standards and we welcome you to attend future CFA Society Baltimore events.

The CFA Society Baltimore works hard to create informative education, networking and soft skills training programs for our current and prospective members.  We strive to provide content that is timely and provide updates on current events in the financial services profession.

I hope you enjoy this publication and find its content engaging and thought provoking.  As always, we welcome your feedback and insights.  To learn more about how CFA Society Baltimore can help support your career and professional network, please visit our website or find us on social media.

Zachary Reichenbach

Zachary C. Reichenbach, CFA, CPA/ABV/CFF
President, CFA Society Baltimore

Message from the Dean

Dear Colleagues and Friends,

Dean Kaynama

I’m excited and proud to share with you the eleventh issue of the Baltimore Business Review: A Maryland Journal. As a joint effort between the faculty of the College of Business and Economics (CBE) at Towson University and the Baltimore CFA Society, this journal leverages the relative strengths of both organizations to create an outstanding resource that showcases opportunities in Maryland and beyond.

CBE is committed to developing high quality and innovative programs and resources, connecting theory to practice in curricular, extra-curricular and research activities, and transforming students who will have a positive impact within Maryland and beyond.

In this issue, you will see how our faculty’s research mirrors CBE’s mission. We are proud to showcase two articles co-authored by faculty members and students—one develops training modules to empower election judges to identify and mitigate threats to voting systems, and the other evaluates the educational impact of civil unrest on children in Baltimore City.

You will also read about how Maryland banks manage their interest rate risks as well as a discussion on the digital transformation of supply chains for Maryland firms. Finally, we present an update from the Towson University Investment Group on portfolios they built based on a student survey.

I would like to express my appreciation to our editors and contributors to this issue of the Baltimore Business Review. It is their generous contributions of time and effort that make this publication possible. We are delighted that you are joining us as readers, and as always, we look forward to hearing any feedback.

Best regards,

Shohreh Kaynama's signature

Shohreh A. Kaynama, Ph.D.
Dean, College of Business and Economics

Student Survey Portfolio Analysis

old building on wall street

Chris Breen
President, Towson University Investment Group

Jacob Piazza
Portfolio Manager, Towson University Investment Group

Zach Foertschbeck
Vice-President, Towson University Investment Group

THE SURVEY

The Towson University Investment Group (TUIG) conducted a research survey that asked participating students what five companies they would invest in if they had $100,000 and how confident they were in their investment knowledge on a numerical scale (1-100). We then created two hypothetical portfolios based on all of the publicly traded company votes. One portfolio for students who have not attended TUIG (General Students) and the other for students who have attended TUIG meetings (TUIG Members). The General Students Portfolio had a total of 95 holdings, whereas the TUIG Members Portfolio had 52. It is important to note that although most students who attend TUIG belong to College of Business & Economics (CBE), TUIG welcomes students from all colleges.

On 10/8/2019 hypothetical portfolios were created via Morningstar to compare key statistics to the S&P 500. Profiles were created to determine whether an aggressive, moderate, or conservative approach was present. Creating two portfolios allows us to show different investment behaviors based on educational background, as demonstrated through involvement in TUIG.

MAJOR HOLDINGS

The top five holdings from the total 2019 survey responses account for 31.5% of the General Student portfolio and 29.2% of the TUIG portfolio [Tables 1]. We see similarities among these portfolios with top holdings in Amazon.com (AMZN), Apple Inc. (AAPL), Alphabet (GOOGL), and Disney (DIS). Among the top five holdings, the portfolio differences lie in Tesla (TSLA) for TUIG members and Microsoft (MSFT) for general students.

In 2018’s survey the top five holdings were APPL (10.5%), AMZN (8.45%), GOOG (5.44%), NKE (4.76%), and TSLA (2.72%). Two changes from 2018 are NKE and TSLA: Both stocks fell two rankings, slipping out of the top 5. NKE and TSLA were the 6th & 7th most frequent responses, replaced in their 2018 positions by Disney (DIS) and Microsoft (MSFT).

SECTOR ALLOCATIONS

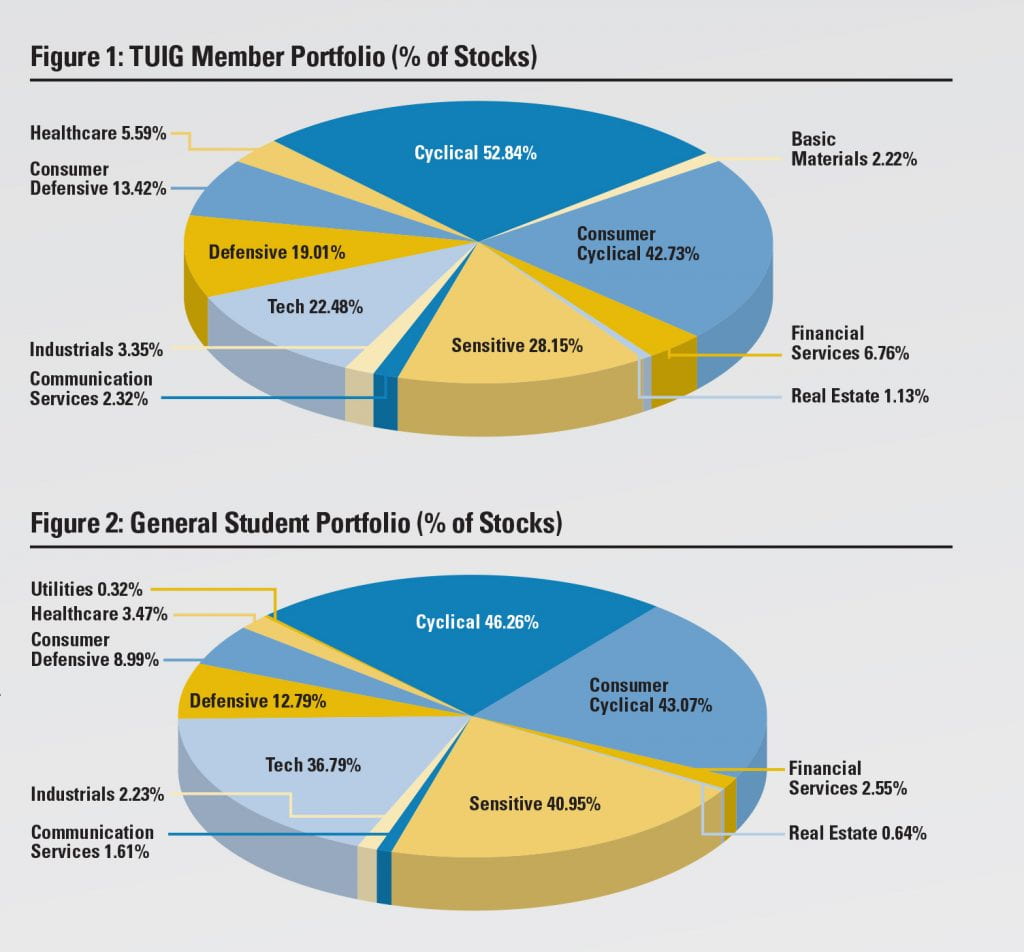
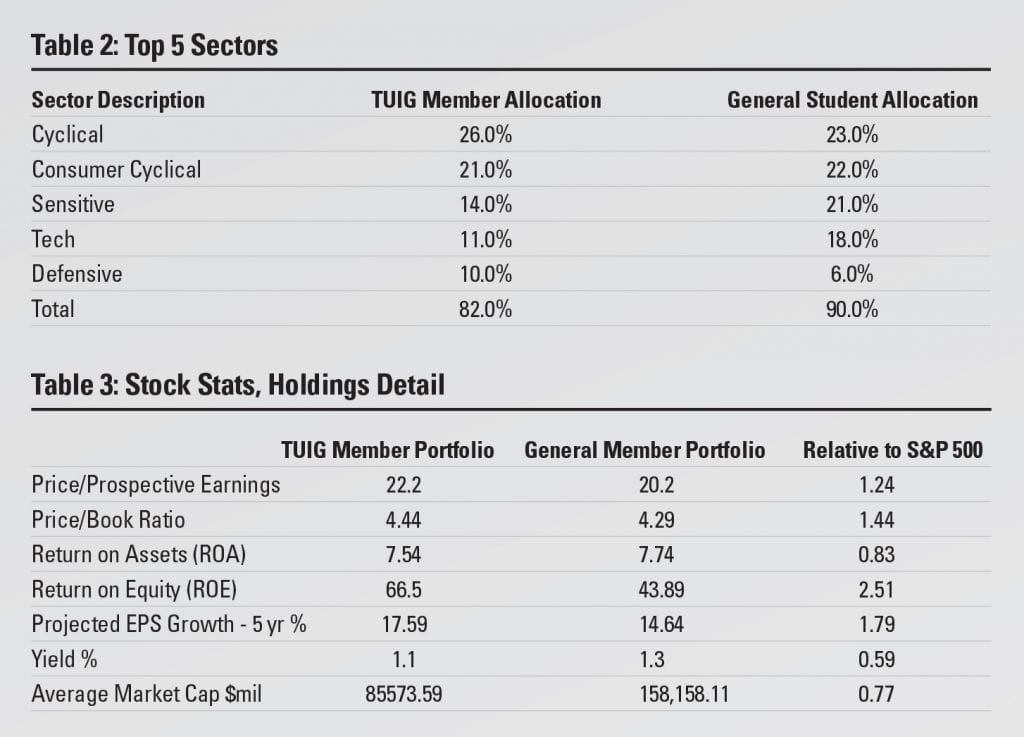
Figures 1 and 2 represent the sector allocations for both hypothetical portfolios, and Table 2 report the top 5 sectors for both the TUIG Member Portfolio and the General Student Portfolio. 90% of the General Student Portfolio is invested in the top 5 sectors, whereas TUIG members have more diversity with only 82% allocated to these 5 major sectors. The difference in diversity indicates a possible narrow scope of attention from general students, whereas TUIG members might have a larger breadth of knowledge across sectors.

figure 1: TUIG member portfolio and figure 2: general student portfolio (charts)

Both portfolios are cyclical-heavy. The interest in cyclical investments is most likely related to the longevity of this bull market. Companies such as Amazon and Disney, who operate in the consumer cyclical sector, have seen prosperous growth over the past decade, and subsequently are very popular choices.

PORTFOLIO METRICS

Table 3 illustrates portfolio characteristics compared to the S&P 500. Both student portfolios have higher market capitalization, which is due to the large weighting of information technology stocks within the portfolios. Students in both portfolios elected to pick high growth stocks as the projected EPS growth greatly outweighed that of the S&P 500. The ROA and ROE of each portfolio is much greater than that of the S&P 500. The General Student portfolio had a lower ROE compared to the TUIG Member Portfolio because it contains a few large retail stores such as Target and Walmart.

Table 2: Top 5 sectors and table 3: stock stats, holdings detail

Both portfolios have great returns so far this year, but with a slowing economy, that could change as we head to the end of the year. Students did not shy away from picking stocks that are greatly impacted by the trade war and possess the risks associated with that.

Table 3 presents insight to the respective approaches in each portfolio compared to the S&P 500. Both portfolios are fairly aggressive compared to the S&P 500. Table 3 shows higher earnings per share in both student portfolios, which reflects the profitable companies that make up the top holdings. Focusing towards aggressive growth makes both portfolios subject to higher individual stock risk than the S&P 500.

As part of our survey, we asked participants to rate their confidence on a scale from 0 – 100: 0 being least confident and 100 being most confident.  On average, TUIG members (52.68) were more confident in their survey responses than general students (37.34).

Table 1: Top 5 Responses

OBSERVATIONS

1. Top Holdings Analysis

As previously discussed, Table 1 displays the five most popular company results from the survey along with the top five holdings for each portfolio. The top holdings for general students matched the overall top responses with slightly different weightings, whereas the TUIG members top holdings were in a different order with the exchange of Microsoft (MSFT) for Tesla (TSLA).  Although TSLA has seen turbulence over the past year, some TUIG members see a valuable business and an opportunity to buy low.

2. Disney’s Double

In the 2018 survey, Disney was the 7th most popular response (2.24%); In the 2019 survey, Disney was tied for 3rd most popular response (5.89%). On July 29, 2019 DIS was trading for an all-time high at approximately $146, and it seems that Towson students would agree that Disney is highly valuable. This is not very surprising in hindsight due to the lucrative acquisitions and successful box office films that seem to never end. Disney’s acquisitions of Pixar (2006), Marvel (2009), Lucasfilm (2012), and recently 21st Century Fox, which also made DIS the majority owner of Hulu, have given the global entertainment platform a surplus of capabilities to create content with pre-existing brand equity. It seems that college students expect Disney to continue on its track of success. On November 12, 2019 Disney Plus (Disney+), a new content streaming platform owned by DIS, will begin launching in the U.S., Canada, and parts of Europe.

3. Lack of Diversification in Stock Selection

A common theme we saw in portfolios, albeit less common in the TUIG Member Portfolio, was a high concentration of large companies that college students use or see every day. Companies such as Amazon, Apple and Disney dominated the survey in terms of popularity. What was interesting was the lack of Utilities, Financial Institutions and overall business-to-business based companies. Although college students frequently deal with companies within these sectors, these companies did not appeal to them as top stock selections.

4. Recent News Drives Interest

In last year’s survey, the legalization of marijuana in Canada had an impact on student stock selections. Canopy Growth Corp. (CGC) and Tilray Inc. (TLRY) saw a 55% increase from the 2017 to the 2018 survey results. This year, however, saw the complete opposite trend as CGC and TLRY were selected by only 2% of students compared to last year’s results of 5%. The stock prices of both of these stocks have also taken a hit as CGC is down 54.37% and TLRY is down 81.19% over the past year.

5. Thematic Investment Strategy

On multiple occasions, students replied to the survey with a general sector that they think would be a good idea to invest in, but they couldn’t come up with a particular company. The sectors included medical marijuana, solar energy, retirement homes, and E-Sports. All of the industries mentioned above are rapidly growing, but with that growth comes a plethora of competition. Due to both factors, it is understandable that Towson students lack the knowledge of what companies to ultimately believe in.

CONCLUSION

Our survey resulted in a total of 100 responses from Towson University Students, each response had the opportunity to choose five companies as hypothetical investments. Between the two hypothetical portfolios, students generally had similar top holdings, however the TUIG members chose stocks that operate in a larger variation of sectors, resulting in a more diverse portfolio. We find evidence that students trend towards familiarity – or brand recognition – but lack confidence in making single-stock investment decisions. Students who attend TUIG – an extracurricular form of exposure financial investing – seem to have a larger breadth of stock familiarity.

Through our tenure as TUIG officers, we have seen first-hand that financial literacy is lacking in many young Americans. Institutions, specifically primary and secondary schools, are taking action by outsourcing the task of teaching financial literacy. One example is Ortus Academy, a Baltimore based nonprofit organization which teaches financial literacy through a simulation-based game. Members of TUIG volunteer with Ortus Academy annually, because we believe that programs like this will lead future generations to become more financially literate. Soon, the Ortus Academy will launch an online platform intended to reach more individuals.

TUIG will host its 12th annual International Market Summit in the Spring of 2020. All employers, alumni, students, and the general public are welcome to attend and hear from our panel of guest speakers discuss the current state of International Markets.

References

https://disneynews.us/important-disney-acquisitions-time-disney-history/

https://www.bloomberg.com/news/articles/2019-04-22/apple-can-relax-why-the-samsung-foldable-phone-failed

https://finance.yahoo.com/quote/CGC/chart?p=CGC

https://finance.yahoo.com/quote/TLRY/chart?p=TLRY

https://www.cnbc.com/2019/08/31/the-trade-war-has-already-cost-electronics-companies-10-billion.html

The Effects of Civil Unrest on Education in Baltimore

crowd of people with shawdow of police officers above

Melissa A. Groves, Ph.D.
Associate Professor, Department of Economics, Towson University

Ryan Hor
Towson University ‘19

Nearly fifty years after the Civil Rights Movement, and twenty-five years after the riots and extreme civil unrest in Los Angeles, the United States started facing more heavily publicized and more frequent cases of sometimes fatal mistreatment of minority groups in urban areas. The largest of which took place in Ferguson, Missouri, a small town of concentrated poverty in the northwest area of St. Louis. Here, the murder of Michael Brown, an unarmed African-American man spurred massive riots in the city of St. Louis for weeks. Baltimore would soon face a similar tragic event, the murder of Freddie Gray. On April 12, 2015, a man named Freddie Gray from Sandtown-Winchester, a small area in the city of Baltimore, died as the result of injuries sustained while being transported in a police vehicle. When fit into the social narrative of the time period, this was the event to revolutionize the people living in the city.

Important to the discussion of civil unrest in Baltimore is the representation of current and past police action. As is a common theme around the country in urban areas and cities, young minority males are the most at danger and in Baltimore, young black males are disproportionately targeted and arrested for drug related offenses when compared to white peers. Buozis (2018) suggests that the history of the black community perceiving themselves to be targeted by police undoubtedly led to the massive protests thereafter. In Baltimore, the growing distrust between the black community and law enforcement was a significant cause of the violent protest and riots in the city as well as the murder of Freddie Gray.

Our results indicate one of two possibilities; that sufficient schools in Baltimore City responded over the year post civil unrest effectively to counter the negative impact, or students the most negatively impacted by the unrest dropped out.

Using data collected on children aged 5-17 living in the inner city of Chicago, Sharkey (2010) finds that African-American children exposed to violence prior to both math and reading testing scored between a half and two thirds of a standard deviation lower than their peers exposed after completing the exams. Looking at the Beltway Sniper attacks in October 2002, Gershersen et. al. (2015) document that exposure to these attacks resulted in a five to nine percentage point decrease in test scores for third to fifth graders – similar in magnitude to ten unscheduled snow days. The recent work by Gershenson and Hayes (2018) attempts to decode the consequences of civil unrest in Ferguson and find that after the shooting, the number of below basic scores in math doubled and reached almost 17% of the student population, and that an increasing number of the students who fell into the below basic category in terms of achievement were black. They also tied these falling scores to attendance and noted the significant falling attendance predominantly within the black community. These negative effects were also short lived, erased predominantly within one year of event, and suggest that an increased effort to reverse the damage by both schools and parents mitigated some of the impact from the event itself.

Decades of research document that human capital allows people to make themselves more valuable and employable in the labor market (Angrist and Krueger, 1991; Ashenfelter and Rouse, 1998). If civil unrest prevents or reduced the possibility of the growth of human capital through education, then it can have an impact on the future outcomes of the students affected by these events.

This paper uses standardized public school testing data in Language Arts and Mathematics surrounding the arrest and death of Freddie Gray. To compare both distance from unrest and how race may mitigate the impact, we focus on three areas: Baltimore City, Prince George’s County, and St. Mary’s County. We consider a simple linear regression model to explain changes in assessments between the 2014 academic year (prior to civil unrest) and 2016 the academic year (after civil unrest):

Changes in reading pass rates = β0 + β1 %Community College + β2 %Four-year College + β3 Attendance + β4 Distance + β5 Distance2

Changes in math pass rates = β0 + β1 %Community College + β2 %Four-year College + β3 Attendance + β4 Distance + β5 Distance2

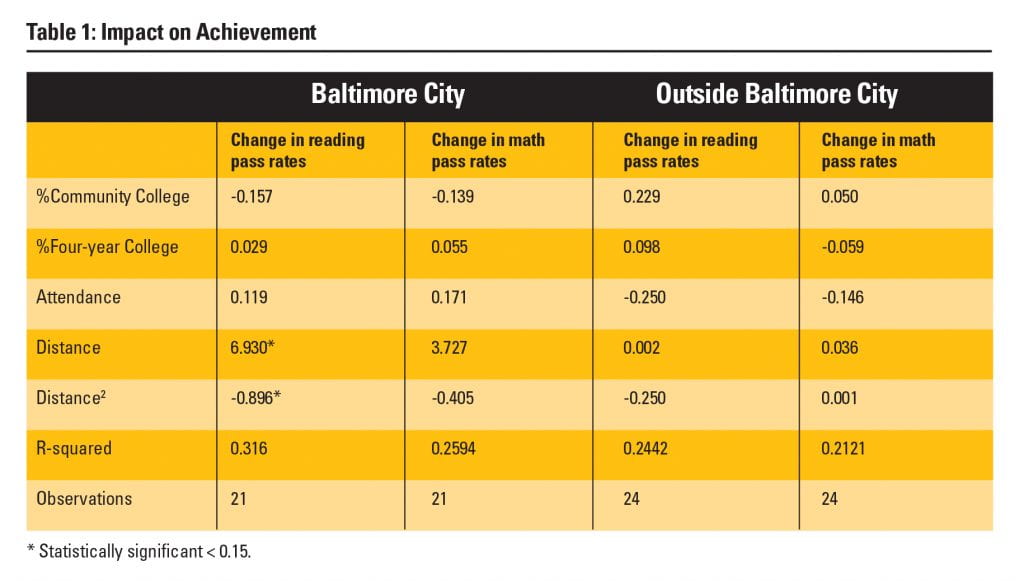
where Changes in reading pass rates and Changes in math pass rates are the changes in reading and math pass rates for each school between 2014 and 2016, %Community College is the percentage of graduating seniors from the school that pursue higher education through a community college or two year educational program, %Four-year College is the percentage of graduating seniors from the school that pursue a four year college, Attendance measures average attendance for the academic year, Distance is the distance in miles from civic unrest in downtown Baltimore and the polynomial is included to evaluate nonlinear effects. These models are run separately for schools in Baltimore City as there is no a priori assumption of marginal effect consistency between counties.

Table 1: Impact on Achievement in Baltimore city and outside Baltimore city

Results presented in Table 1 suggest that farther distance from civic unrest results in more improved readings scores. The findings are only statistically significant for inside Baltimore City, as anticipated, and indicate that on average, each mile closer to the unrest decreases scores by almost seven points. For schools beyond the city limits, even those with a higher percentage of African American children (Prince George’s County compared with Saint Mary’s), the effects were smaller in magnitude and statistically insignificant.

In our second test, we examine the effect of proximity to the unrest on the likelihood of falling math test scores. Contradictory to our expectation, we find that each mile farther from the civil unrest increases the log likelihood of falling math test scores by 5.8% between 2014 and 2016. We believe that our results indicate one of two possibilities; that sufficient schools in Baltimore City responded over the year post civil unrest effectively to counter the negative impact, or students the most negatively impacted by the unrest dropped out.

In our third test, we investigate how distance influence the likelihood of the dropout. We find subtle empirical support that schools located a greater distance from civic unrest had lower dropout rates and hence suggests that closer proximity to civil unrest resulted in higher dropout rates.

Conclusions

The economic literature overwhelmingly finds that education is the strongest determinant of success in the labor market as measured through wages or earnings. If civil unrest disproportionately disrupts educational success of minority children, it creates roadblocks for future opportunities in the labor market. Enter Baltimore City, who frequently finds its school system on the list of worst performing districts in the nation with more than forty percent of their schools being labelled as ‘chronically low performing’. In addition, an astonishing 90 percent of Baltimore City Public School children, who are predominantly minority students, consistently scored low on standardized tests (Green 2011). For these reasons, it is of critical importance to understand if Baltimore City school children are disproportionately harmed and at an educational disadvantage because of civil unrest and if so, programmatic changes in communities and schools can be developed to lessen the negative impact.

This study looks to evaluate the educational impact of civil unrest on children in Baltimore City. Using data from Baltimore City along with Prince George’s and Saint Mary’s counties, we find that students living in close proximity to civil unrest face a short run negative impact from civil unrest that is not shared by peers living farther from the events. We hope that these findings can help to extend the discourse on the significant and disproportionate impact of civil unrest.

References

Angrist, Joshua D. and Alan B. Krueger. 1991. “Does compulsory school attendance affect schooling and earnings”, Quarterly Journal of Economics 106: 979 – 1014.

Ashenfelter, Orley and Cecilia Rouse. 1998. “Income, schooling and ability: evidence from a new sample of identical twins”, Quarterly Journal of Economics 113: 253 – 284.

Buozis, M. 2018. “Bizarre Dissonances in Baltimore”: Class and Race in the Color-blind Discourses of Police Violence. Democratic Communiqué, 27(2), 36-52.

Gershenson, et al. “The Effect of Community Traumatic Events on Student Achievement: Evidence from the Beltway Sniper Attacks.” NBER, University of Chicago Press, Mar. 2015.

Gershenson, Seth and Michael S. Hayes. 2018. Police Shootings, Civil Unrest, and Student Achievement: Evidence from Ferguson. Journal of Economic Geography, 18(3): 663-685.

Green, Erica L. “Number of city schools missing academic targets surges”, Baltimore Sun, July 14, 2011. Accessed online: https://www.baltimoresun.com/maryland/baltimore-city/bs-md-ci-ayp-schools-20110714-story.html

New Education Majority: Attitudes and Aspirations of Parents and Families of Color. 2016. The Leadership Conference Education Fund.

Sharkey, Patrick. (2010). The Acute Effect of Local Homicides on Children’s Cognitive Performance. Proceedings of the National Academy of Sciences of the United States of America. 107, 11733-8.

Endnotes

1 Recent reports have indicated that while 31% of the Maryland state population is black, they comprise 70% of the state’s prison population (@JusticePolice.pic.twitter.com/rMlcgXRCAb)

2 The reading high school assessment proficiency rate varied significantly among the three counties. All three faced similar 4 percentage point decreases per year starting in 2012. Following the 2015 academic year, Baltimore City and Prince George’s counties experienced the greatest decrease.

3 The math high school assessment proficiency rate for Baltimore schools peaked in 2009 at 71.57% and then between 2011 to 2016 decreased at an alarming rate with only 53.45% of students scoring proficient in math by 2016. While some of this may be due to civil unrest, the steady decline beginning in 2011 suggests an additional factor may contribute to both the civil unrest and falling scores.

4 This variable is the mean distance from the school to two different locations of significant civil unrest: downtown harbor area of Baltimore and Edmondson.

The Management of Interest Rate Risk: Are Maryland Banks Different?

old bank

Babu G. Baradwaj
Professor, Department of Finance, Towson University

Michaël Dewally
Associate Professor, Department of Finance, Towson University

Susan M.V. Flaherty
Professor, Department of Finance, Towson University

Yingying Shao
Associate Professor, Department of Finance, Towson University

Banks, as financial intermediaries, transform risk. They take riskless deposits to finance risky loans. The resulting mismatch between the maturity of deposits and loans exposes banks to interest rate risk: unexpected changes in interest rates impact banks’ performance. When interest rates are volatile and hard to predict, banks must manage interest rate risk effectively to protect capital and prevent insolvency.

While it is crucial for banks to carefully assess and manage their exposure to interest rate risk, there is no theoretically optimal solution for banks to determine the desired level of their risk exposure. Banks, in general, are willing to assume interest rate risk to a certain extent to increase their profitability, especially when the yield curve shifts.

Traditionally, banks rely on active management of the maturity gap to control interest rate risk. With the development of financial innovations, more and more banks have adopted off-balance-sheet activities such as using interest rate derivatives to manage their interest rate risk. In light of these considerations, it is important to know to what extent banks rely on interest rate derivatives and thus evaluate their ability to adjust their interest rate risk exposure.

How do Maryland Banks
Manage their Interest Rate Risk?

We aim to: (1) quantify interest rate risk and examine how it changed over time and (2) assess how banks manage their interest rate risk exposure. Banks control their exposure by either modifying the maturity mismatch between on-balance-sheet assets and liabilities (on-balance-sheet restructuring) or relying on interest rate derivatives (off-balance-sheet adjustment). Most of Maryland banks are relatively small in asset size and follow a traditional business model. Their exposure to interest rate risk impacts their performance including both profitability and solvency. We also investigate if Maryland banks behave differently than other banks in the nation.

Using data from banks’ quarterly Call reports between 2000 and 2016, we measure interest rate risk exposure in two ways. This first measure is “maturity GAP”, computed as the difference in 12-month maturity between the banks’ assets and liabilities divided by total assets (Sierra and Yeager, 2004). The difference or GAP between interest rate sensitive assets and liabilities can be multiplied by a forecasted change in interest rates to approximate the change in net interest income. Banks take deposits and issue loans in various terms and rate structures, e.g., fixed-rate vs. floating-rate instruments, whose impact on the economic value of banks is different. When the interest rate increases, a bank that finances fixed-rate, long-term loans with short-term deposits will suffer a decline in profits because the interest income from loans remains fixed yet the cost of funds increases. Using this approach, a bank with a positive on-balance-sheet maturity gap is viewed as an asset-sensitive bank and those with a negative maturity gap as liability-sensitive, and a lower maturity mismatch corresponds to higher risk management activities. It should be noted that banks will position their balance sheets based on their forecast of interest rates. Positive gap (asset sensitive) balance sheets may increase net interest income during a rising interest rate environment while negative gap (liability sensitive) balance sheets may increase net interest income during a falling interest rate environment.

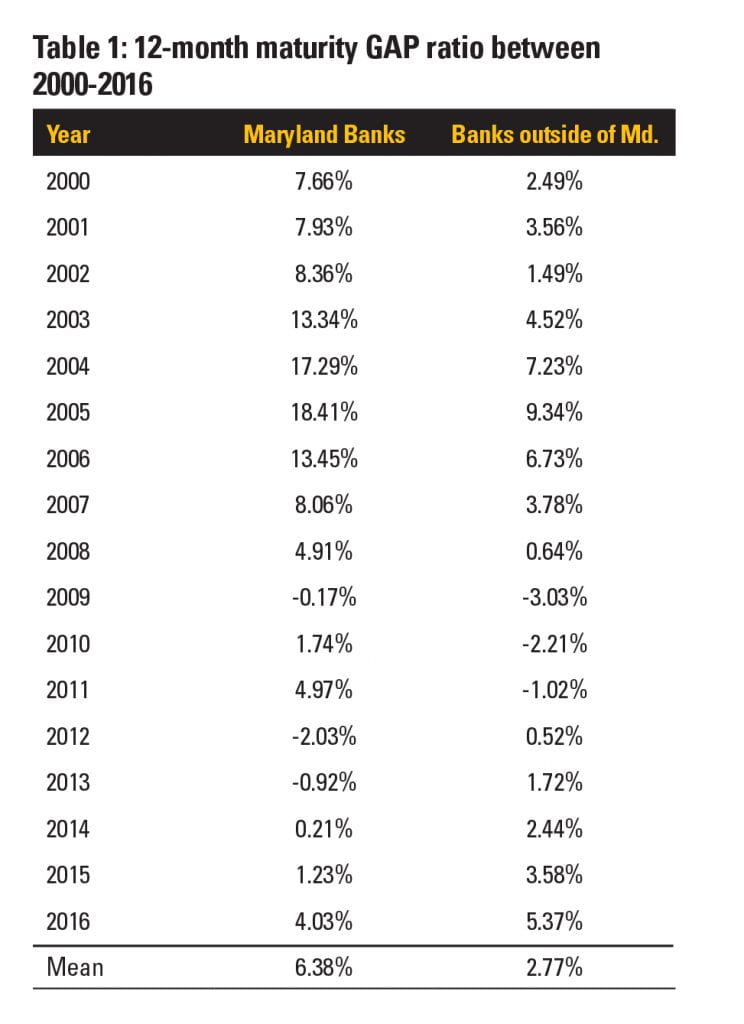
Table 1: 12-month maturity GAP ratio between 2000-2016

Table 1 provides summary statistics of the 12-month maturity GAP as a measurement of interest rate risk management for commercial banks from 2000–2016. Overall, banks in Maryland show a significantly higher level of GAP ratio compared to the average of other banks in the nation, indicating a lower level of management of interest rate risk. However, this situation has changed greatly after the 2007-2009 crisis as Maryland banks show a great drop in the GAP ratio, leading to a lower level ratio than banks in other states. The 2000-2006 average difference of outside- to inside-Maryland GAP ratio of 7.30% dropped to -0.17% for the 2010-2016 period. Maryland banks are now more insulated from interest rate risk.

The second measure is based on banks’ position in “derivatives used for hedging purposes” (Purnanandam, 2007). For each bank, we take the notional amount of derivatives reported under the non-trading purposes and scale it by the total assets of the bank at the end of each quarter.

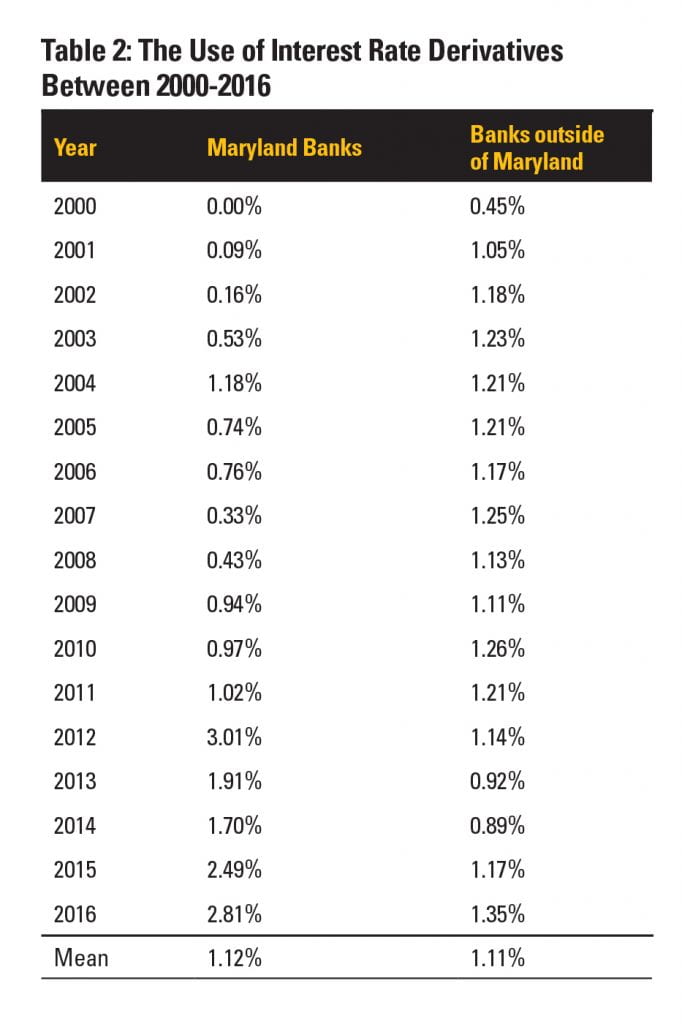
Table 2: The Use of Interest Rate Derivatives Between 2000-2016

Table 2 provides summary statistics of the interest rate derivatives used for interest rate risk management purposes by commercial banks from 2000–2016. It is clear from this table that Maryland banks have become more active in managing interest rate risk since the financial crisis. The average hedging ratio of Maryland banks in the years since 2009 has significantly outpaced the hedging ratio of banks in other states. Maryland banks’ average hedging ratio for 2010-2016 is 1.99% compared to an average of 1.13% for banks outside of Maryland. This finding is consistent with that of Table 1 whereby Maryland banks are currently actively controlling for interest rate risk.

Business Model

Are the differences noted above related to banks’ financial conditions and business models?

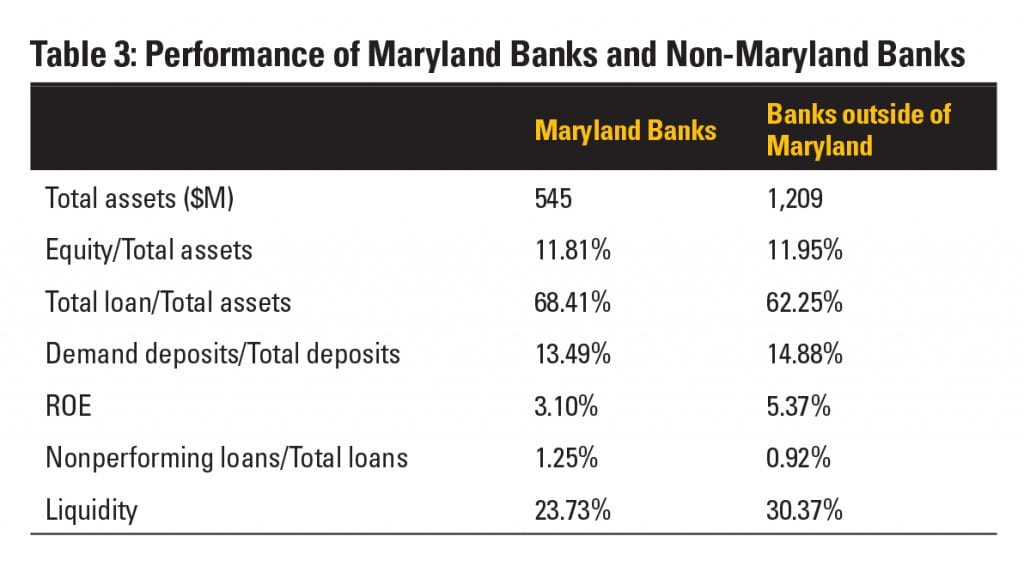
Table 3: Performance of Maryland Banks and Non-Maryland Banks

Table 3 reports statistics to help us compare the performance of Maryland banks to that of other banks in the nation. While Maryland banks are in general smaller than banks in other states, they show a higher level of loan ratio, lower level of demand deposits, and a similar level of capital reserve. In addition, Maryland banks seem to underperform other banks in terms of ROE, nonperforming loans, and liquidity conditions. This is consistent with the findings in the literature that banks with higher probability of financial distress manage their interest rate risk more aggressively, both by means of on-balance sheet and off-balance sheet instruments (Purnanandam, 2007). 

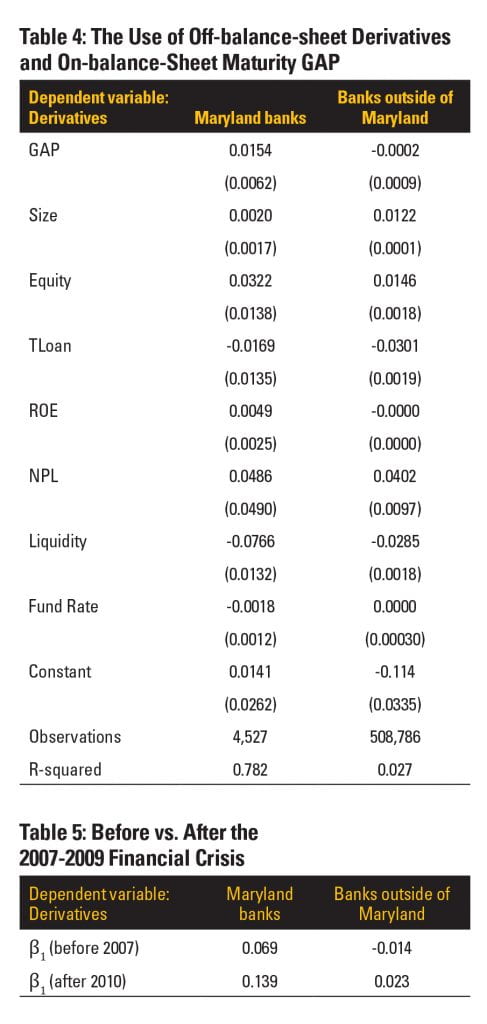
In practice, banks manage interest rate risk primarily via their on-balance-sheet maturity structure and then decide whether to rely on interest rate derivatives as alternative tools. We conduct a test to examine to what extent banks’ use of interest rate derivatives is determined by banks’ on-balance-sheet maturity gap as the following:

Derivatives=α+β1 GAP+β2 Size+β Equity+β4 TLoan+β5 ROE+β6 NPL+β7 Liquidity+β8 FundRate+T+S+ε,

where Size is the logarithm of total assets, NPL is the ratio of loans over 90 days late plus loans not accruing to total loans, and Liquidity is defined as (Cash + Fed Funds Sold + Securities) divided by total assets. Fund Rate is the federal funds rate and measures the changes in interest rate over time.

We are particularly interested in the sign of coefficient β1. A negative (positive) value suggests that banks have used interest rate derivatives to substitute (complement) the on-balance-sheet exposure to interest rate risk.

The results in Table 4 show that Maryland banks use interest rate derivatives as a complement to traditional maturity gap matching in managing interest rate risk. On the contrary, banks outside of Maryland, in general, substitute one strategy for the other.

Table 4: The use of off-balance-sheet derivatives and on-balance-sheet maturity GAP

In addition, we run subsample tests using the time windows before 2007 and after 2010 respectively to see whether banks change interest rate risk management strategies significantly after the 2007-2009 financial crisis. The following table reports the value of regression coefficients only.

Table 5 shows that while Maryland banks have been consistently using interest rate derivatives as complementary to the traditional maturity matching approach in managing interest rate risk, other banks in the nation, in general, have been operating differently. Before the crisis, non-Maryland banks used off-balance-sheet interest rate derivatives as a substitute to on-balance-sheet interest rate risk management and only have switched the role of interest rate derivatives after the crisis.

While our findings document a response to the crisis, further study is required to determine how bank behavior is changing due to this protracted period of low long-term interest rates. Banks exhibit better performance when long-term rates are higher than shorter rates. Currently, long-term rates are negligibly higher than short-term rates. As banks adapt to a continual low rate environment, banks may take on more risk to generate yield which may increase derivative usage. This would further exacerbate the difference in derivative use between Maryland banks and those outside of Maryland.

References

Purnanandam, A., 2007. Interest rate derivatives at commercial banks: an empirical investigation. J. Monet. Econ. 54 (6), 1769–1808.

Sierra, G.E., Yeager, T.J., 2004. What does the federal reserve’s economic value model tell us about interest rate risk at U.S. community banks. Fed. Res. Bank St. Louis Rev. 86 (6), 45–60.

Former FDIC Chair Sheila Bair Is Optimistic About the Potential of Technology to Improve Financial System, While Expressing Concern About Non-Financial Debt

new graduates throwing their caps into the air

Farhan Mustafa, CFA
Head of Investment Risk Management and Head of Quantitative Investments, ClearBridge Investments

CFA Society Baltimore held its Future of Finance conference at the Baltimore Marriott Waterfront hotel on November 15, 2019. We had the privilege to host The Honorable Sheila C. Bair as the keynote speaker. Here is a brief profile of Ms. Bair, followed by a synopsis of her comments, with some editorial additions for context and data where necessary. In summary, Ms. Bair is concerned about several developments in lending markets that fall outside of traditional banking. The U.S. consumer remains healthy, which is supportive of economic growth, but the student loan picture is worrisome. Over the long run, Ms. Bair is optimistic about several developments in the technology sector that have the potential to improve the financial system.

Ms. Bair has had a long and distinguished career in government, academia, and finance. She is best known as Chair of the Federal Deposit Insurance Corporation (FDIC) from 2006 to 2011, when she steered the agency through the worst financial crisis since the Great Depression, working to bolster public confidence in the nation’s banking system. She received numerous awards and recognition for her leadership at the FDIC, including the JFK Library’s Profiles in Courage Award. She was twice named by Forbes Magazine as the second most powerful woman in the world and was dubbed the “little guy’s protector in chief” by Time Magazine. Time also placed her on the coveted “Time 100” most influential people, and profiled her on its cover, along with Elizabeth Warren and Mary Schapiro, as one of the “New Sheriffs of Wall Street.” In 2012, CFA Institute and The Pew Charitable Trusts founded the Systemic Risk Council (SRC), which was led by Ms. Bair. The SRC’s goal is to improve systemic risk oversight and to give investors greater confidence in global financial markets. Ms. Bair currently serves on several corporate and fintech boards, while continuing her advocacy for common sense policies to promote financial system stability and responsible lending practices, including most recently, her strong national leadership against rising college costs and excessive student debt.

Student debt has grown by 33% over the past five years, the fastest-growing segment of consumer credit over this period, and currently stands at $1.6 trillion versus $1.0 trillion in credit card and $1.2 trillion in auto loan debt.

The 2008-2009 financial crisis was rooted in the nation’s financial institutions, including the banking sector. In the current cycle, Ms. Bair noted several worrisome developments in the non-financial segment of the economy, including leveraged loans, corporate debt, student debt, and federal debt. Ultimately, she is concerned that stresses in the leveraged loan market could catalyze into an economic recession.

Ms. Bair noted that the amount outstanding of leverage loans has exploded in recent years and defaults in this segment could result in another financial crisis. At the same time, the reduced role of synthetic derivatives in the current market is positive as these instruments were at the epicenter of the 2008-2009 financial crisis.

A leveraged loan is typically extended to corporations or individuals that already have high levels of debt and/or low credit ratings. Leveraged loans tend to feature higher risk of default and therefore carry higher interest rates and are most costly to the borrower. According to the Bank of England’s July 2019 Financial Stability Report, gross issuance of leveraged loans in the U.S. reached a post-crisis high in early 2018 but has slowed since then. The share of new leveraged loan issuance with no maintenance covenants has more than tripled since 2007 and remains close to record highs in 2019. Other traditional investor protections in loan terms have also been relaxed (such as restrictions on borrowers’ ability to transfer collateral beyond the reach of the lender), potentially increasing losses to lenders in the event of default. Finally, borrowers are also increasingly indebted globally, with the average reported debt to EBITDA (earnings before interest, taxes, depreciation and amortization) ratio of the borrowers issuing new leveraged loans around levels observed in 2007.

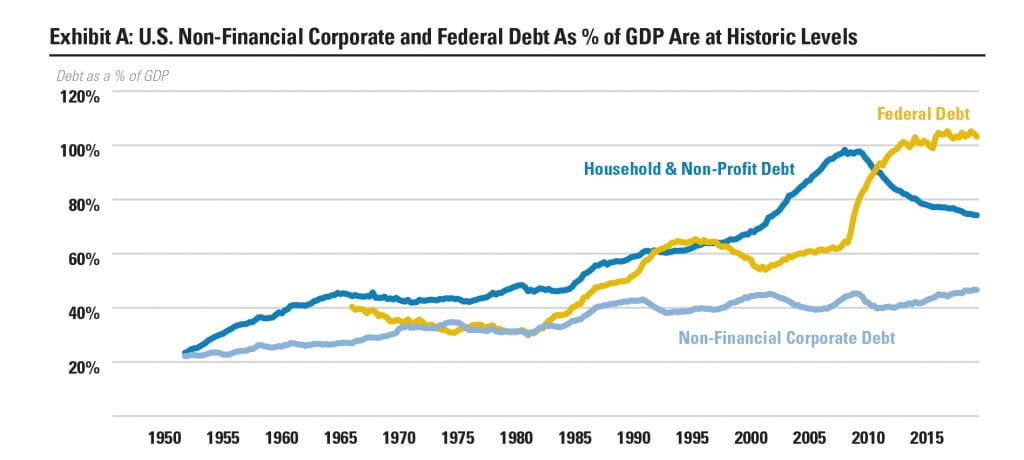
Exhibit A: U.S. Non-financial Corporate and Federal Debt AS % of GDP Are at Historic Levels

Debt issued by U.S. corporations is another area of concern. Companies have taken out record levels of debt (Exhibit A), largely due to nearly a decade of record-low interest rates. This has not been a problem so far, but the current level of leverage is worrisome because the cost of servicing this debt could create financial distress in a higher interest rate environment. According to the Bank of England’s July 2019 Financial Stability Report, US corporate debt is above pre-crisis levels as a share of GDP and, in part reflecting rapid growth of leveraged lending, the share of debt owed by highly leveraged US companies has reached pre-crisis levels of above 40%. Ms. Bair is also concerned about the rising level of federal debt (Exhibit A) for similar reasons. Specifically, the federal government has proven adept at spending money but the overall lack of fiscal responsibility and the current administration’s policies to weaponize the dollar are concerning.

On the positive side, the U.S. consumer is in good shape, with a strong labor market and manageable household debt (Exhibit A). At the same time, young consumers are saddled with historic levels of student debt (Exhibit B). Ms. Bair noted that this type of debt is generally considered “good” debt because it is being used in productive investment into the labor force, but this does not appear to be the case in the current cycle. According to Federal Reserve data, student debt has grown by 33% over the past five years, the fastest-growing segment of consumer credit over this period, and currently stands at $1.6 trillion versus $1.0 trillion in credit card and $1.2 trillion in auto loan debt. According to Bloomberg News, the cost of tuition at private and public institutions is touching all-time highs, while interest rates on student loans are also rising, increasing the risk that student loan default rates could exceed levels experienced after the 2008 financial crisis.

Exhibit B: U.S. Student Loans Have Grown Faster than Credit Card or Auto Loans

In response to an audience question, Ms. Bair noted that the ongoing issues in the overnight repurchase (repo) market are also concerning. She expects these movements have nothing to do with regulations but are likely due to bank deposits being too low. Following the financial crisis, the U.S. Treasury moved its deposit accounts from commercial banks to the Federal Reserve.  On September 16, 2019, quarterly estimated taxes were due, and the U.S. Treasury issued securities, which caused commercial bank balances to be too low to support the repo market. Ms. Bair is sympathetic with the Federal Reserve’s decision to inject liquidity into this segment and noted that the situation should improve with the yield curve not being inverted any more.

Earlier this week, the Bank of International Settlements (BIS) released its December 2019 quarterly review, in which they discussed repo market stress. BIS explained that the repo market has become heavily reliant on four banks as marginal lenders. These banks’ liquid assets have skewed more toward Treasury securities, which limited their ability to supply short-term funding. At the same time, increased demand for funding from leveraged financial institutions likely compounded the stress, which was further amplified by the Federal Reserve’s withdrawal of large-scale asset purchases in a market that had become used to the availability of abundant reserves.

Meanwhile, Ms. Bair is optimistic about several exciting developments in the technology sector that have the potential to improve the financial system.

Distributed ledger technology is the most promising among these. A distributed ledger comprises a network of replicated, shared, and synchronized digital data geographically spread across multiple sites, countries, or institutions, which use a peer-to-peer network and consensus algorithms are required to ensure replication across nodes. When a network participant updates their copy of the ledger with a new transaction, each node constructs the new transaction, and then the nodes vote by consensus algorithm on which copy is correct. Once consensus has been determined, all the other nodes update themselves with the new, correct copy of the ledger. The blockchain system underlying crypto currencies such as Bitcoin is one example of the distributed ledger technology.

The distributed ledger technology has tremendous potential to increase efficiency and productivity in the financial markets. For example, this technology could revolutionize interbank transactions by removing intermediaries and minimizing counterparty risk. From the perspective of a regulator, every individual and business in an economy could maintain an account at the central bank, which would facilitate seamless transactions as well as regulatory oversight. Private business cannot do this on their own, but this is a promising idea for a central bank. In fact, China is already adopting distributed ledger technology into its financial system and other central banks are also looking into it, including the U.S. Federal Reserve.

Ms. Bair is not very enthusiastic about artificial intelligence (AI) because current applications are limited to tasks that can be algorithmized and because AI systems are good at identifying correlation but not causation in a system.

Ms. Bair noted that applications of artificial intelligence are limited to areas where some task or procedure can be fully algorithmized, but such systems are not effective in systems where all possible outcomes are unknown, and decisions need to be made in the presence of uncertainty. Another issue with artificial intelligence is that it is very good at identifying correlations but does not have the capacity to identifying causal relationship. One of the most basic tenants of statistics is that correlation does not imply causation. We can only trust a model to perform as expected over time if we understand its theoretical basis. Moving beyond correlation to causation is especially important when it comes to understanding the conditions under which a machine learning model may fail, how long we can expect it to continue being predictive and how widely applicable it may be. Current AI systems are good at learning from past data, but these systems largely rely on pattern recognition to develop predictive models without an understanding of how and why the models work.

In conclusion, Ms. Bair is optimistic about the role of new technologies in shaping the landscape of our financial system, but the road directly ahead is likely to be bumpy due to excesses in the non-financial segments of the market and the risks these excesses pose for markets and the economy.

Sources:

CFA Institute Co-Sponsors Systemic Risk Council Led by Former Bank Regulator Sheila Bair https://blogs.cfainstitute.org/marketintegrity/2012/06/06/cfa-institute-co-sponsors-systemic-risk-council-led-by-former-bank-regulator-sheila-bair/

Bank of England’s Financial Policy Committee Financial Stability Report, July 2019

Bank for International Settlements Quarterly Review – International Banking and Financial Market Developments, December 2019

Board of Governors of the Federal Reserve System

Griffin, Riley, The Student Loan Debt Crisis Is About to Get Worse, Bloomberg News, October 17, 2018. Retrieved from https://www.bloomberg.com/news/articles/2018-10-17/the-student-loan-debt-crisis-is-about-to-get-worse on December 10, 2019.

Heltman, John, What Ongoing Repo Turmoil Means for Banks, American Banker, December 3, 2019. Retrieved from https://www.americanbanker.com/list/what-ongoing-repo-turmoil-means-for-banks on December 11, 2019

From Digitization to Digital Transformation of Supply Chains

warehouse worker looking at digital projections

Tobin Porterfield
Associate Professor, Department of Business
Analytics & Technology Management, Towson University

Chaodong Han
Associate Professor, Department of Business
Analytics & Technology Management, Towson University

The global economy runs on supply chains. Global supply chains move products, services, information and financials between upstream suppliers, manufacturers, logistics providers, wholesalers, and retailers to downstream customers. Ideally, an efficient global supply chain should operate seamlessly across national borders, company boundaries and internal organizational functions. The reality, however, is that supply chains operate in silos and each player focuses on optimizing their own operation, making true optimization of the entire supply chain nearly impossible. Emerging technologies have the potential to break down those siloes and help improve communication and collaboration across firm and functional boundaries. However, digitization of some business processes based on certain technologies may not be sufficient; a systematic digital transformation of business processes and organization structures is needed to optimize the entire supply chain.

Digitization

Digitization is the application of technologies to make processes more efficient and it is the first step in transforming an organization. In a business context, digitization simply means the removal of paperwork and conversion of analog information (handwritten, typewritten, faxed, and voice data) into digital forms (email, messaging, PDF, chat, and databases), resulting in improved efficiency and performance.

We experience the benefits of digitization when we place an order on Amazon and receive an email confirmation from the seller that includes a link to UPS with the tracking number. A simple click on the tracking number retrieves information from UPS on the status of our delivery. Digitization has bridged companies and technology platforms allowing us unprecedented access to information which improves visibility and transparency.

Internally companies have implemented enterprise resource planning systems (ERPs) that integrate disparate operations (sales, warehousing, purchasing, accounting, human resources, and finance) on a single platform that allows real-time access to information supporting improved decision making.

According to Rich Sherman who has helped develop the SCOR model, “Digitization removes the time delay in communicating variability across the supply chain. Digitization gives people more time to respond to change. It removes latency from the supply chain. That’s the real value of digitization” (Supply Chain Management Review, 2019). These implementations of digitization often provide strong ROI and fast payback for organizations by quickly cutting processing costs. Process-oriented automation and information sharing have become competitive imperatives where organizations must convert in order to survive.

Digitalization

Digitalization is the process of employing digital technologies to transform business operations across internal and external boundaries. The focus is not on efficiency by lowering costs, but on outcomes that transform business. These technologies are end-user driven, adaptive to the changing landscape and they facilitate collaboration. Current examples include Artificial Intelligence (AI) / Machine Learning (ML), Robotic Process Automation (RPA), Internet of Things (IoT), Blockchain, and collaborative cloud technologies (e.g. Slack, Monday, Fleep, Workzone, Smartsheet, and Asana). These are not big-bang, big-bucks, one-shot technology implementations. To be successful these technology solutions need to support the needs of the end-user in ways that will create new business opportunities.

Artificial Intelligence/Machine Learning

AI/ML technologies allow organizations to extract meaningful information from the overwhelming plethora of data available to support decision making. Sifting through millions of data elements to adjust pricing strategies in real-time is now possible. In finance, AI can detect patterns in data to identify fraudulent transactions. Weather data, traffic patterns, and demand surges can be integrated to improve lead time and delivery estimates. When computers can “learn” the logic used by humans to interpret data and make decisions, selected tasks can be automated for faster decisions 24/7. AI has the potential to transform the health care industry as well and a few AI-based tools have been approved by regulators for use in real hospitals and doctors’ offices.

Robotic Process Automation

RPA technologies are not platform specific so they allow end users to identify routine processes that can be automated regardless of the systems on which they run. Mundane tasks like time sheet entry, data extraction, and data input can be partially or fully automated such that the data is extracted by the bot and emailed to the person for a decision.

Internet of Things

IoT brings together data from our internet-connected devices. For a business, this can support the tracking of a shipment from the time it leaves the shelf to its arrival on the customer’s doorstep with scanners and devices detecting and sharing information throughout the process. Logistics routing decisions can be improved real-time based on congestion data from phones, automobiles, toll booths, and roadside devices. IoT is used to track inventory, equipment, containers, and machine capacities to improve asset utilization, customer service, information visibility, and reliability.

Blockchain

Blockchain technologies allow information to be distributed without being compromised. Altering of the data can be detected by others in the network resulting in improved reliability of the data while increasing transparency and visibility. In supply chains where multiple players provide data into the process, blockchain creates a playing field where all participants can view the data but none can alter the data without detection. This is already finding application in the global food supply chain where traceability and accountability related to contamination are critical. In a typical global food supply chain, all participants – growers, suppliers, processors, distributors, retailers, regulators, and consumers – can gain permissioned access to known and trusted information regarding the origin and state of food from farm to table. This can enable all stakeholders of the supply chain to utilize a secured blockchain network to trace a contaminated product to its source quickly to ensure safe recall and removal from store shelves.

Collaborative Technologies

The virtual workforce demands technologies that support their dynamic and disparate work locations. These technologies provide file sharing, communication, and coordination by integrating cloud storage, cameras and microphones, project management tools, messaging, and email applications. First to allow work to be completed efficiently in a distributed environment but second to create an environment where a diverse workforce can collaborate. New adaptations of these technologies are released on a daily basis and they operate wherever people want to work on whatever devices people prefer.

Digital Transformation

Organizations have already made great strides in moving processes from analog systems to digital platforms. That strategy has been effective in reducing transaction costs and improving processing speed. But digitization alone will not necessarily create a sustainable competitive advantage. To get ahead and stay ahead, organizations must look to flexible and dynamic technologies that transform business by generating unique ongoing competitive advantages that harvest the power of our data and the creative juices of our workforce.

These implementations are often driven by a virtual workforce. They require tools to support collaborative work which requires changes in a business model and may lead to new revenue and value-producing opportunities. This involves a strategic mandate to transform the end to end business model with a focus on the customer. Digital transformation has profound implications for all businesses and their supply chains, including the acquisition of digital skills which has now become a prerequisite for individual, industry, and regional success.

Global companies headquartered in the Baltimore region have been active in developing and utilizing cutting-edge technologies to achieve competitive advantages in their respective landscapes.

Using IBM Research AI for Product Composition, Hunt Valley-based spice giant McCormick is able to “explore flavor territories across the globe more quickly and efficiently, utilizing technology to extract key insights for millions of data points across sensory science, consumer preference and flavor palette”, according to CEO Mr. Kurzius (McCormick & Co., 2019). In 2019 McCormick launched its first AI-enabled product platform, “ONE,” with a set of initial one-dish Recipe Mix flavors including Tuscan Chicken, Bourbon Pork Tenderloin, New Orleans Sausage and Glazed Salmon.

McCormick also joins other food producers and distributors, including Dole, Driscoll’s, Golden State Foods, Kroger, McLane Company, Nestlé, Tyson Foods, Unilever, and Walmart to further champion blockchain as an enabling technology for the food sector (Fortune, 2017). McCormick understands that food safety issues such as cross-contamination, the spread of food-borne illness, unnecessary waste and the economic burden of recalls can be costly without timely access to information and traceability. It is time-consuming to identify the precise point of contamination, which may cause further illness, lost revenue and wasted product.

Athletic footwear company Under Armour partnered with IBM’s Watson to create the UA Record App, which provides coaching and guidance for individuals’ daily routines, including activity levels and fitness, nutrition, and sleep. Powered by cognitive technologies, this app is expected to customize fitness programs for individual users, track food intake with computer vision technologies and recommend workouts based on local weather, visibility, and goal trajectories. The UA Record app will share health and fitness insights comparable to other individuals with similar characteristics, including average weight, average resting heart rate and average steps taken per day. Meanwhile, Under Armour hopes that the Cognitive Coaching System powered by IBM Watson is able to transform athlete engagement and motivation in the following areas: behavioral and performance management, food intake tracking and overall nutrition management, and how weather and environmental factors affect training (IBM, 2016).

In terms of RPA, Under Armour streamlined its seasonal product creation process with Winshuttle Transaction, reducing manual data entry by 80% and empowering end-users to run data transfers without excessive IT intervention. Prior to using Winshuttle, Under Armour would need 550 to 600 person-hours to transfer the data from its product development system into SAP. Now it is down to 112 hours, meaning that the entire process can be reduced from 10 days to just two (Winshuttle, 2019).

Stanley Black & Decker selected its Enterprise AI Platform to transform its business into an AI-driven enterprise by building the best machine learning models for a specific problem, including demand forecasting. This AI implementation replaced an outdated and extremely manual approach. Stanley Black & Decker will deploy the DataRobot platform, including Automated Machine Learning and Automated Time Series, to further enhance its predictive analytics capabilities and dramatically reduce the time spent on data wrangling and model building. This will free the team up to focus on other business challenges and opportunities while simultaneously driving tremendous business value (DataRobot, 2019).

Conclusion

Digitization, converting paper-based processes to electronic, is absolutely necessary in today’s business economy but it is not sufficient to create a sustainable competitive advantage. Organizations must embrace the dynamic disruptive technologies that can be adapted in new ways to transform their organizations. We are already seeing how AI/Machine Learning, RPA, Internet of Things, Blockchain, and Collaborative Technologies are being put to work and we can expect more technologies to come available in the near future.

References

DataRobot (2019). Stanley, Black & Decker selects DataRobot to supersize data science efforts,  https://www.datarobot.com/news/press/stanley-black-decker-selects-datarobot-to-supersize-data-science-efforts/. Accessed November 1, 2019.

Fortune (2017). Walmart and 9 food giants team up on ibm blockchain plans, https://fortune.‌com‌/‌2017/08/22/walmart-blockchain-ibm-food-nestle-unilever-tyson-dole/. Accessed November 3, 2019.

IBM (2016). Under Armour and ibm to transform personal health and fitness, powered by IBM Watson, https://www-03.ibm.com/press/us/en/pressrelease/48764.wss. Accessed October 28, 2019.

McCormick & Co. (2019). McCormick & Co. delivers on new product launches. https://‌www.‌foodbusinessnews.net/articles/13537-mccormick-co-delivers-on-new-product-launches. Accessed October 30, 2019.

Supply Chain Management Review (2019). NextGen supply chain Q&A: Rich Sherman.  https://‌www.‌scmr.com/‌article/‌nextgen_‌supply_chain‌_qa‌_rich‌_sherman. Accessed October 29, 2019.

Winshuttle (2019). Under Armour improves SAP master data loading with Winshuttle, https://‍‌www.‌winshuttle.‌com/‌assets/‌case‌-study-under-armour/. Accessed November 4, 2019.

When Does A Good Investment Become a Bad Investment?

close up of a person's eyes watching stocks

Niall H. O’Malley, MBA
Portfolio Manager, Blue Point Investment Management

A good investment becomes a bad investment when it becomes evident to the buyer that they overpaid. This concept applies not only to individual investors, but also in the case of share buybacks, when a company overpays for shares. Typically, share buybacks are used by a company to return earnings to shareholders. The shareholders who do not sell the company shares benefit from having a greater share of the earnings, or a bigger slice of the pie. Two disturbing trends are that increasing numbers of share buybacks do not represent the return of reported earnings or overseas cash and many publicly traded companies have been taking on huge amounts of debt to finance share buybacks when their shares are at record valuations.

Quite simply, when a company overpays for shares, it destroys shareholder value. The value destruction becomes greater when a company borrows money to finance the share buyback, since the company must also pay interest on the debt used to buy back the shares. Further, the increased debt compromises the company’s financial flexibility. Economic downturns and/or unforeseen events challenge companies in unexpected ways, which make financial flexibility and balance sheet equity an important asset. When a company artificially increases earnings per share by decreasing the number of shares outstanding, it is called financial engineering. Many companies have used financial engineering to mask declining sales, including IBM, which had declining sales for 20 consecutive quarters, but showed earnings per share as up every quarter due to massive share repurchases. 

What motivates a company’s management team to destroy financial flexibility and engage in debt financed share buybacks? The answer may be that some of the legislative changes following the 2008 financial crisis have had unintended consequences. The Dodd-Frank Act enacted in 2010, requires a say-on-pay vote for public companies giving proxy adviser firms like Institutional Shareholder Services significantly greater influence. Institutional Shareholder Services recommended that 50% of equity awards for management be performance based. The performance goals for senior management are tied to shareholder returns with little emphasis placed on balance sheet strength.

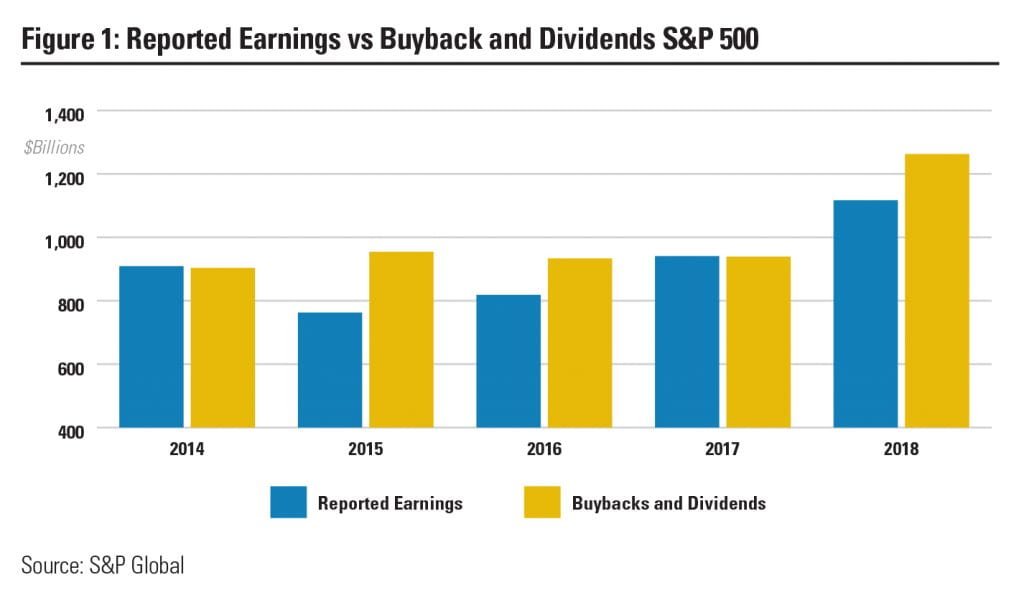
reported earnings vs buyback and dividends S&P 500

What is Causing Differences in the Capital Market?

In the U.S., equity market valuation levels have dramatically exceeded economic growth since the 2008 financial crisis. Are these valuation levels sustainable? At first blush it would appear to be: The sustained expansion of the U.S. business cycle is the longest on record since World War II. What is different with this business cycle versus earlier business cycles? A critical distinction is that after the Second World War, the U.S. used fiscal policy to create the Eisenhower freeway system, and manufacturers produced goods for a world that needed to rebuild. During the current business cycle the inverse has occurred: U.S. fiscal policy to invest in outdated infrastructure has remained untapped, and domestic manufacturing has struggled to grow. The current business cycle is different in another unprecedented way: It is driven almost exclusively by monetary policy. The Federal Reserve bought fixed income securities by printing trillions of dollars. Equities became a beneficiary of printed money, since it meant there was more money chasing equity securities. Central bank quantitative easing has pushed interest rates to record lows. This has caused the cost of debt to be lower than the return on equities. Public company management teams are arbitraging return advantage created by record low interest rates and pocketing hefty performance awards.

S&P 500 Buyback and Dividends Over the Past Five Years

In three of the last five years, buybacks and dividends exceeded reported earnings for the S&P 500. The 2017 tax reform legislation lowered corporate income taxes and permitted overseas cash to be repatriated, dramatically increasing buybacks and dividends in 2018. What is troubling – as seen in the table on the previous page – is that in 2015 and 2016 buybacks and dividends also exceeded reported corporate earnings in the S&P 500. This means company management teams are consuming more company resources then they produce. The reported earnings per share are not sustainable.

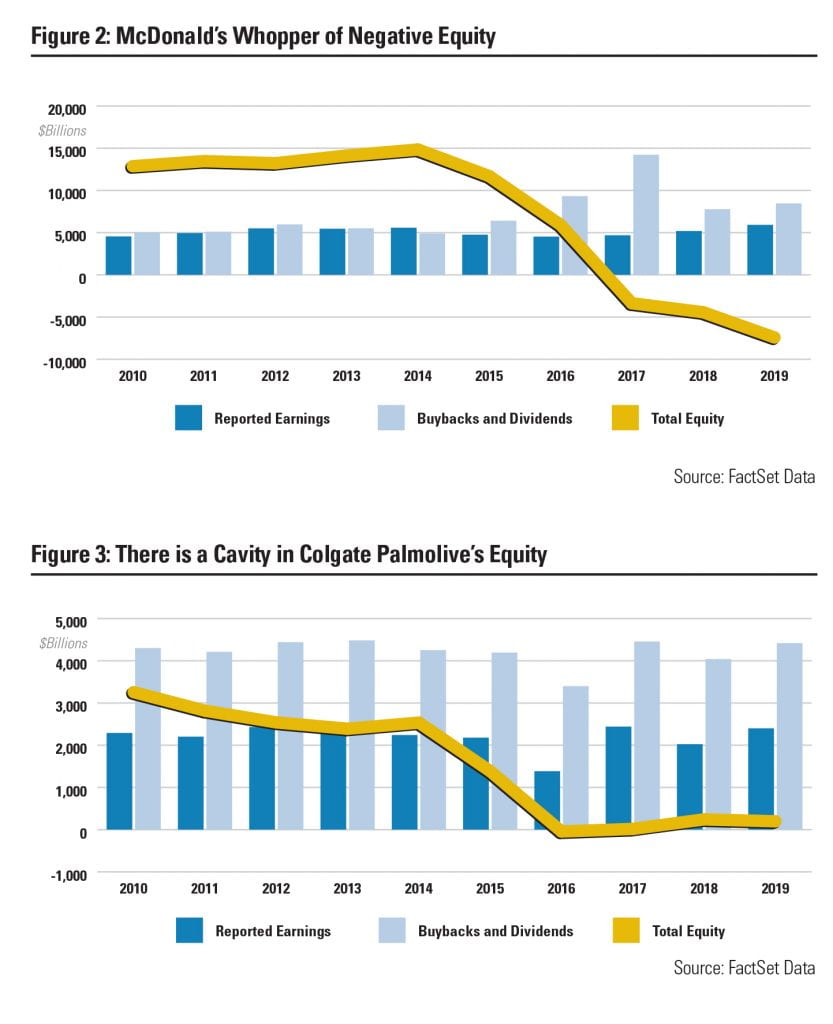
McDonald's Whopper of negative equity (chart) and there is a cavity in colgate (chart)

Companies Draining their Balance Sheet with Operations in Maryland

Three companies draining their balance sheets and creating negative shareholder equity with operations here in Maryland are McDonald’s, Colgate Palmolive, and Home Depot. Negative equity is when a company’s liabilities are greater than their assets, which means shareholder equity has a negative value. Share repurchases are not the only reason negative equity can occur. Negative equity can also occur when a company writes down the value of an acquisition. While there are other sources of negative equity, for the purposes of this article the focus is on the discretionary actions of management that create negative equity.

Ten years ago, McDonald’s had over $14 billion in shareholder equity. Today, shareholder equity is less than zero. McDonald’s long-term debt, which is increasingly used to finance share buybacks, has grown by over $31 billion which has helped crowd out shareholder equity. McDonald’s liabilities exceed its assets, which means shareholder equity at the end of 2018 stood at a negative value of -$6.2 billion. While McDonald’s share price has hit new highs, the negative equity value creates genuine questions about sustainability, since the balance sheet already has substantial negative equity. Management is borrowing from the future financial strength of the company to finance today’s performance goals. Overpaying for share buybacks is a real risk.

Ten years ago, Colgate Palmolive had over $3 billion in shareholder equity. Today, shareholder equity is less than $200 million. Colgate Palmolive’s long-term debt has grown by over $3.5 billion which has helped crowd out shareholder equity. Colgate Palmolive has a sky-high return on shareholder equity, but that is due to  so little shareholder equity to begin with – less than 2% of assets. Like McDonald’s, Colgate Palmolive’s management is borrowing from the future financial strength of the company to finance current performance goals. 

home depot's home improvement equity is negative

Ten years ago, Home Depot had almost $20 billion in shareholder equity. Today, shareholder equity is less than zero. Home Depot’s long-term debt has grown by over $18 billion which has helped crowd out shareholder equity. Home Depot’s liabilities exceed its assets, which means shareholder equity at the end of 2018 stood in the red with a negative equity of -$1.8 billion. The Home Depot share price has hit a number of all-time highs, partially created in part by management’s choice to deplete the company’s balance sheet. Management is borrowing from the future financial strength of the company to facilitate performance goals.

Conclusion

There is a growing disconnect between the growth rate in earnings per share for companies and the reported earnings growth rate. Share buybacks are materially altering the earnings per share growth rates, which in turn raises questions about sustainable growth. Each of the companies cited have strong cash generation, but the share buybacks in excess of reported earnings are not sustainable. While this article focuses on the troubling growth in negative equity, it important to remember equity is a residual measure. Arguably the most important measure of a business’s strength is the ability to generate cash from operations.

Managers have a responsibility to find the lowest cost of financing, but excessively low interest rates are creating an unhealthy over-indulgence in debt as low-cost debt is used to replace higher cost equity. The distortions created by record low interest rates are increasingly distorting corporate balance sheets. Manager performance goals are further contributing to the incentive to use debt. Taken together, share buybacks have been one of the most powerful forces driving share prices higher. Too much of anything eventually becomes a negative.

The purpose of this article is to discuss a negative trend that compromises financial flexibility in these and other companies using debt to fund share buybacks and boost share price. General Electric could have fixed its own problems if it had maintained balance sheet flexibility rather than spending over $53 billion to buy back shares at higher valuations in the decade prior to 2017. From an active management perspective, Blue Point looks for sustainable trends that support sustainable growth. The growing debt levels associated with share buy backs that exceed reported earnings are troubling, and the elevated levels of share buybacks may not be a good investment.

Resources

https://corpgov.law.harvard.edu/2014/10/02/what-has-happened-to-stock-options/

https://www.institutionalinvestor.com/article/b1dfj9g9mfnqxb/Share-Buybacks-May-Be-Bad-Just-Not-for-the-Reasons-You-Think

https://thesoundingline.com/dividends-and-buybacks-now-larger-than-total-reported-earnings-for-the-entire-sp-500/

https://www.theatlantic.com/magazine/archive/2019/08/the-stock-buyback-swindle/592774/

https://www.cmgwealth.com/wp-content/uploads/2017/03/document_1072753661.pdf?mod=article_inline

https://www.wsj.com/articles/where-have-all-the-public-companies-gone-1510869125

https://www.cfo.com/credit-capital/2019/10/imf-warns-of-19-trillion-corporate-debt-risk/

https://fortune.com/2019/08/22/ge-stock-buybacks-financials/

Empowering Election Judges to Secure our Elections

people standing in line to vote

Natalie M. Scala
Associate Professor, Department of Business Analytics & Technology Management, Towson University

Josh Dehlinger
Professor, Department of Computer and Information Sciences, Towson University

Lorraine Black
Graduate Student in Supply Chain Management, Towson University

Saraubi Harrison
Solutions Architect, Amazon Web Services

Katerine Delgado Licona
Juvenile and Economic Crimes Unit, Baltimore County State’s Attorney’s Office

Aikaterini Ieromonahos
Major in Law & the American Civilization, Towson University

Introduction and Motivation

The use of electronic voting equipment in the United States’ elections has been commonplace since the early 2000s, with the idea first introduced by the Help America Vote Act of 2002 (US EAC, 2018). The introduction of electronic voting equipment was, in part, a response to the punch-cards controversy in the 2000 Presidential Election and the subsequent Bush v. Gore court proceedings. The cybersecurity issues related to electronic equipment became of widespread concern during the 2016 Presidential Election, with a report and congressional testimony by Special Counsel Robert S. Mueller, III confirming that the Russian Federation took sweeping and systematic actions, in violation of United States criminal law, to interfere in the election (Helderman and Zapotosky, 2019; Mueller, 2019). Although evidence does not point to equipment and voter records actually being compromised, the Department of Homeland Security revealed that 21 states, including Maryland, were subject to cybersecurity attacks on their voting registration files or public election sites by the Russian Federation (Horwitz, Nakashima, and Gold, 2017). The Senate Intelligence Committee also concluded that election systems in all 50 states were targeted by Russia in 2016 (Sanger and Edmonson, 2019).

Our ongoing, funded, and student-centered research takes a unique systems approach to elections security and specifically considers potential cyber, physical, and insider threats to an election. Cyber threats can exist regardless of an active Internet connection; physical threats involve tampering with equipment; and insider threats stem from human interactions with the process (Price, et al., 2019). This approach distinguishes our research from existing literature, which generally focuses only on cyber threats. We further differentiate from existing research by focusing on local polling places; most existing research is at the state level. We consider varied sources of threat and consider polling places, because those places are where the public actually interacts with the voting process. The experience the public has at a polling place drives overall confidence in voting integrity. For example, if voters have positive experiences at a polling place, they may feel confident in the voting system. However, if the polling place was disorganized or equipment malfunctioned in front of voters, for example, they may not feel confident their votes were accurately recorded. Thus, it is crucial that not only are the actual security and integrity of votes maintained during early voting and on Election Day, but also the public has a positive and affirming experience at the polls.

Our research takes a “see something, say something” approach and develops training modules for Election Judges to identify and respond to potential cyber, physical, and insider threats that may emerge during early voting and on Election Day. The training empowers Election Judges to mitigate emerging security issues or elevate them for proper assistance. Security issues that may emerge at a polling place must be immediately remedied, as elections cannot be redone or rescheduled. An election has one chance to correctly and securely record votes; the confidence in, and health of, our democracy depends on election integrity.

Threats and the Maryland Process

We partnered with the Harford County Board of Elections in Maryland to develop training modules. All counties in Maryland employ the same process and use the same equipment during early voting and on Election Day, and polling places are arranged into the following general sections or stations: check-in, voting booths, scanning unit, provisional voting, and disabled access. Maryland uses a paper ballot on which voters indicate their choice by filling in bubbles with pen marks; those ballots are then counted at the polling place using an optical scanner. The ballots are then retained in bins under the scanner as a paper trail. Various Election Judges are assigned to each station, and a Chief Election Judge oversees the entire polling location. Threats may emerge at any station at a polling place. Threats may evolve from accidents or honest mistakes made by voters and/or Election Judges, or threats may emerge from those interacting with the process with malicious intent. The developed modules train Election Judges to recognize that a threat may be present and equips them with the actions to take to mitigate the threat. The modules also review proper equipment usage, in an effort to avoid an Election Judge inadvertently becoming an insider threat through honest mistakes and improper use of equipment. Examples of threats that may occur at a polling place are outlined in Price, et al. (2019); that paper identifies 25 potential vulnerabilities to the Maryland election process, even though no evidence exists that those vulnerabilities were previously compromised in an election. Other related sources of risk in elections security, categorized into cyber, physical, and insider threats, are discussed in Locraft, et al. (2019).

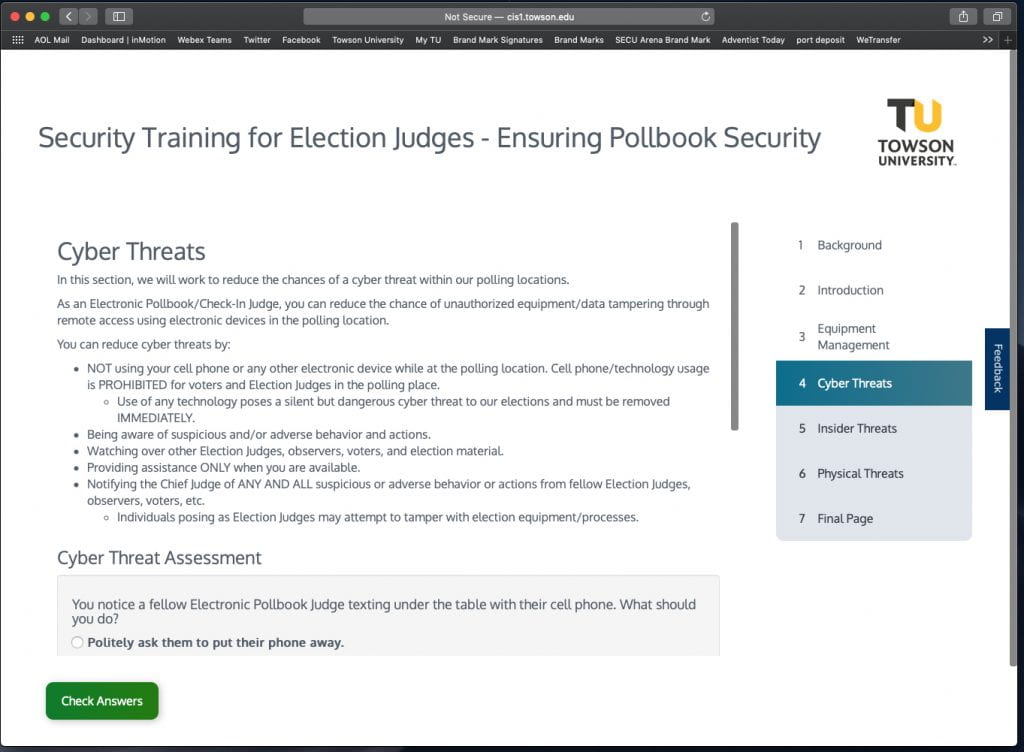
screenshot of the training module on pollbook security

Design of Modules

We created a training module for each of the five general stations at a Maryland polling place. Specifically, the modules created are for electronic pollbooks, voting booths, the scanning unit, provisional voting, and ballot marking devices. Electronic pollbooks are digital records of all registered voters and are used to verify voters at the check-in station. Voters mark their paper ballots in voting booths. The scanning unit reads the marked bubbles on ballots and records votes. Provisional voting is reserved for voters whose registration cannot be confirmed at the check-in station. Ballot marking devices are primarily used to assist disabled voters with marking their choices on their ballots, although all voters are welcome to use the marking device. We also created a module for Chief Judges, as they have unique responsibilities to oversee and manage the entire polling location. Each module has four main training sections: equipment use, cyber threats, physical threats, and insider threats. Self-assessment questions are at the end of each section, and a user must correctly answer each question to move on to the next section. Users receive a Certificate of Completion upon completion of the entire module. As an example of module design, Figure 1 provides a screenshot from the cyber threats section of the electronic pollbooks module.

As noted in Price, et al. (2019), a cyber threat may be related to phones used on-site containing existing malware or other cyber-related concerns. Thus, the electronic pollbooks module addresses that threat by instructing Election Judges not to use their cell phones or any other electronic device while at the polling location. Similar approaches are taken in all modules for each type of threat. Furthermore, the equipment section identifies proper handling and use of equipment before, during, and after the polling place is open. Considering threats over time (before, during, and after) supports other research we have in development that takes a Markov chain approach to assess overall threat and risk (Price, et al., 2019; Locraft, et al. 2019). Educating Election Judges on equipment use should help to mitigate against threats that may emerge from mistakes and improper handling. Equipment use may also address more nuanced threats, such as a lack of synchronization between multiple pollbooks that, if persisting, may indicate malfunctioning or compromised equipment.

Election Judges are our first line of defense to the security of our elections. Our training modules instill self-efficacy in Election Judges and Chief Judges regarding identifying and mitigating cybersecurity threats.

Module Deployment

To deploy our modules, we use the established Security Injections@Towson e-learning system (Taylor & Kaza, 2011). The Security Injections@Towson project has developed an ecosystem of over 50 teaching/training modules that introduce cybersecurity in computing classes; each module is packaged and hosted within the system. Our library of training modules, along with a supportive ecosystem of materials and resources for election officials will be housed on the project website. The Security Injections@Towson project is increasingly recognized as a model for introducing secure coding in lower-level programming classes. As of 2019, over 360 faculty, across 221 institutions, including 91+ community colleges and several high schools, have completed more than 3,100 cybersecurity modules (Cyber4All, 2019). We anticipate similar accessibility and opportunity for use by counties and Election Judges pertaining to our training modules.

Goals and Conclusions

The goal of these training modules is to empower Election Judges to identify and mitigate threats that may emerge at a polling place during early voting or on Election Day. Harford County Election Judges participate in in-person training in the months leading up to an election. However, the in-person training currently does not include training on cyber, physical, and insider threats outside of active shooters. Therefore, we advise that the online modules to be administered two to three weeks prior to Election Day or Early Voting so that Election Judges can have a refresher on how to use the equipment as well as an opportunity to gain knowledge on identifying and mitigating potential threats. In some Maryland jurisdictions, such as Baltimore City and Prince Georges’ County, hiring Election Judges on the day of the election is not uncommon. In those cases, a poll worker has no previous training before having access to and interacting with the process. As a result, we advise day-of hires to interact with the module before beginning their work. In that scenario, an Election Judge can have a basic introduction to equipment use along with the crucial cyber, physical, and insider threat awareness training.

Election Judges are our first line of defense to the security of our elections. Our training modules instill self-efficacy in Election Judges and Chief Judges regarding identifying and mitigating cybersecurity threats. Knowing that Election Judges are equipped to address threats if they occur at a polling place and that they clearly know how to handle the voting equipment should increase the public’s confidence in and improve their experience at polling places. Managing cyber, physical, and insider threats enable the integrity of votes to be maintained throughout the entire process.

We are currently conducting a follow-up study to assess the degree to which Election Judges learn about equipment use and cyber, physical, and insider threats from interacting with the training modules. The study employs pre- and post-tests to assess learning. Preliminary results show, with statistical significance, that Election Judges do learn and become aware of threats and mitigations while interacting with the modules.

These modules will be used by Harford County during the 2020 Presidential Election cycle. We encourage all Maryland counties and cities to adopt these modules as part of their poll worker training. Together, we can ensure the security of our elections.

Acknowledgments

Towson University’s School of Emerging Technologies and the BTU Initiative partially funded this research and module creation. The authors would especially like to thank the Office of Civic Engagement and Social Responsibility at Towson University for their support of the follow-on learning assessment study. The authors would also like to thank Cynthia Remmey and the Harford County Board of Elections team for their ongoing support of and engagement in this research.

References

Cyber4All. (2019). Security Injections Home. Retrieved from https://cis1.towson.edu/~cyber4all/index.php/security-injections_home/

Helderman, R. S., & Zapotosky, M. (2019). The Mueller report: Presented with related materials by The Washington Post. New York: Scribner.

Horwitz, S., Nakashima, E., & Gold, M. (2017, September 22). DHS tells states about Russian hacking in 2016 election. The Washington Post. Retrieved from https://tinyurl.com/HorwitzEtAl

Locraft, H., Gajendiran, P., Price, M., Scala, N. M., & Goethals, P. L. (2019). Sources of risk in elections security. Proceedings of the 2019 IISE Annual Conference. Retrieved from https://tinyurl.com/LocraftEtAl2019

Mueller III, R. S. (2019). Former Special Counsel Robert S. Mueller, III on the Investigation into Russian Interference in the 2016 Presidential Election. U.S. House of Representatives Committee Repository, https://docs.house.gov/meetings/IG/IG00/20190724/109808/HHRG-116-IG00-Transcript-20190724.pdf

Price, M., Scala, N. M., & Goethals, P. L. (2019). Protecting Maryland’s voting processes. Baltimore Business Review: A Maryland Journal. Retrieved from https://www.cfasociety.org/baltimore/Documents/BBR_2019%20Final.pdf#page=38

Sanger, D. & Edmonson, C. (2019, July 25). Russia targeted election systems in all 50 states, report finds. The New York Times, https://www.nytimes.com/2019/07/25/us/politics/russian-hacking-elections.html

Taylor, B., & Kaza, S. (2011, June). Security injections: modules to help students remember, understand, and apply secure coding techniques. In Proceedings of the 16th annual joint conference on Innovation and technology in computer science education
(pp. 3-7). ACM

United States Election Assistance Commission. (2018). Help America Vote Act. Retrieved from https://www.eac.gov/about/help-america-vote-act/

Regulation Best Interest: Higher Standards for Broker-Dealers, Strengthened Protections for Investors

abstract image of 100 dollar bills imposed over columns

Michael P. Shaw, Esq.,
Partner, Niles, Barton & Wilmer, LLP

On June 5, 2019, the Securities and Exchange Commission (the “SEC”) approved a higher standard of care for broker-dealers (“Brokerage Firms”) and their financial professionals (“Brokers”) when making a recommendation to an investor regarding a securities transaction. This new higher standard, referred to as Regulation Best Interest or Reg BI, is intended to narrow the gap between the different standards of care that a Broker and an investment advisor (“Investment Advisor”) must abide by when making recommendations to an investor.

For more than two decades, Brokers have been held to a suitability standard of care. In other words, a Broker’s recommendation to an investor has, prior to Reg BI, been limited to an analysis of whether the Broker’s recommendation is appropriate given the investor’s age, risk tolerance, investment objectives, and other factors. Suitability was thought to be aligned with the transactional nature of a Broker’s relationship with an investor. Investment Advisors, on the other hand, have been held to a fiduciary standard of care, which refers to a requirement to act in a client’s best interest. Because investment advice is considered ongoing in nature and can cover a broad array of services, Investment Advisors have been deemed to be in a relationship with a client that requires loyalty and trust, hence the need for a higher standard of care than the suitability standard. Over time, the distinction between the services offered by Brokers and Investment Advisors has become less clear, prompting the SEC to re-evaluate the applicable regulatory regimes and to bring the standards of care owed by these two groups of investment professionals closer together.

The key tenet of Reg BI is that when a Broker makes a recommendation of a securities transaction or an investment strategy involving securities to an investor, the Broker must: (1) act in the best interest of the investor at the time the recommendation is made; and (2) not place the financial or other interest of the Broker ahead of the interest of the investor. (Emphasis added.)

Reg BI has four components. A Broker is required to comply with each component to remain in compliance with the regulation. The discussion below presents the key elements of these components, as described in the SEC’s Final Rule in Release No. 34-86031:

1. Duty of Care – Before making a recommendation to a retail investor (as opposed to a corporate/ institutional investor), a Broker is now required under Reg BI to understand the risks and costs associated with a recommendation and consider these factors in view of the investor’s age, investment objectives, and risk tolerance.

The “Care Obligation” of Reg BI requires a Broker to exercise reasonable diligence, care, and skill in making the recommendation. This requires the Broker to understand potential risks, rewards, and costs associated with the recommendation, then consider those risks, rewards, and costs in view of the investor’s investment profile, and have a reasonable basis to believe that the recommendation is in the investor’s best interest. A Broker must consider reasonable alternatives, if any, offered by the Brokerage Firm in determining whether there is a reasonable basis for making the recommendation. And the Broker must not place his/her interests ahead of the investor’s. (Emphasis added.)

2. Conflicts of Interest – Under Reg BI’s “Conflict of Interest Obligation,” a Brokerage Firm must have written policies and procedures to identify conflicts of interest, and the Brokerage Firms must enforce these policies and procedures to address conflicts of interest.

At a minimum, a Brokerage Firm is required to disclose its conflicts to investors, such as the conflict that arises with respect to a Broker’s compensation. Some conflicts can be avoided entirely, such as eliminating sales contests that may lead unintentionally to unnecessary transactions in client accounts. Another example of a conflict that can be avoided is a Broker favoring the Brokerage Firm’s proprietary products over other products that may be more appropriate for the investor because of financial incentives offered by the Brokerage Firm to sell its products. In such cases, the Brokerage Firm’s policies and procedures must be reasonably designed to disclose any limitations in its product offerings and associated conflicts, and to prevent the limitations from causing the Broker to place his/her or the Brokerage Firm’s interests ahead of the investor’s. In general, Brokers are required to eliminate conflicts of interest wherever possible, and Brokerage Firms are required to identify and address incentives that can lead their Brokers to put their own interest ahead of the investor’s.

Finally, the policies and procedures must be reasonably designed to identify and eliminate sales contests, sales quotas, bonuses, and non-cash compensation that are based on the sale of specific securities or specific types of securities within a limited time period. (Emphasis added.)

3. Disclosure – Reg BI now requires Brokerage Firms to disclose the fees they charge, the type and scope of the services they offer as well as any limitations on those services, any conflicts that exist, and whether the Brokerage Firm provides ongoing monitoring of an investor’s account.

Under Reg BI’s “Disclosure Obligation,” a Broker must provide certain prescribed disclosures before or at the time of the recommendation about the recommendation and the relationship between the investor and the Broker. These disclosures must include: (a) that the Broker is acting in a broker-dealer capacity with respect to the recommendation; (b) the material fees and costs that apply to the investor’s transactions, holdings, and accounts; and (c) the type and scope of services to be provided, including any material limitations on the securities or investment strategies that may be recommended to the investor. Additionally, Brokers must disclose all material facts relating to conflicts of interest associated with the recommendation that could benefit the Broker, such as conflicts associated with proprietary products, payments from third parties, and compensation arrangements. (Emphasis added.)

The Attorneys General in seven states and the District of Columbia have filed a lawsuit against the SEC in federal court in an effort to block implementation of Reg BI.

4. Compliance – Brokerage Firms are required to develop, maintain and enforce policies and procedures to comply with Reg BI.

Under Reg BI’s “Compliance Obligation,” a Broker must establish, maintain, and enforce policies and procedures reasonably designed to achieve compliance with Reg BI. The SEC does not intend a Brokerage Firm’s compliance with Reg BI to create new and potentially duplicative records for each recommendation to an investor. Rather, the SEC believes that Brokerage Firms should be able to explain in broad terms the process by which the firm determines what recommendations are in an investor’s best interest, and to explain how that process was applied to a specific recommendation to the investor. The SEC is not, however, mandating that Brokerage Firms create and maintain a record of each such determination.

In conjunction with approving Reg BI, the SEC also approved and now requires that both Brokers and Investment Advisors, at the beginning of an investor relationship, provide an investor with a Customer Relationship Summary (Form CRS) to allow the investor to compare one financial professional’s services to those of another. Form CRS must contain a summary of the services offered, fees charged, costs, conflicts of interest, standard of conduct, and disciplinary history, if any, of the firm and its financial professionals.

In promulgating Reg BI, the SEC also provided guidance on two areas of federal securities laws that have led to some confusion. First, the SEC clarified the federal fiduciary duty that an Investment Advisor owes to a client under the Investment Advisers Act of 1940 (the “Advisers Act”). Second, the SEC clarified the long-standing exemption that applies to a Broker who provides advice to an investor that is considered “solely incidental” to the brokerage transaction, and where the Broker does not receive special compensation for that advice. Now, according to the SEC’s new interpretation of “solely incidental,” the advice provided by a Broker must be “reasonably related to the broker-dealer’s primary business of effecting securities.”

Reg BI and Form CRS became effective on September 10, 2019. The SEC’s new interpretations of the federal fiduciary duty and “solely incidental” also became effective on that date. The SEC has, however, extended the enforcement date of Reg BI and Form CRS until June 30, 2020 to give Brokerage Firms time to modify their compliance programs.

This article has evaluated the components of Reg BI, and the effect that this new regulation will have on Brokerage Firms and their Brokers. But what about investors? Will investors be able to discern any noticeable difference that Reg BI brings about in a Broker’s recommendations? Certainly, investors who pay close attention to disclosure documents will be aware of the new Form CRS that Reg BI requires a Broker and an Investment Advisor to complete and provide to the investor. For most investors, however, Reg BI will not lead to any noticeable change in the way that a Broker or an Investment Advisor makes a recommendation. This is not to say that Reg BI will not have an impact on investors. The four obligations that a Broker must satisfy to comply with Reg BI – Disclosure, Care, Conflict of Interest, and Compliance – will impact investors by raising the standard of care and due diligence required of a Broker in making a recommendation in a way that goes well beyond that which is required by the suitability standard of care.

As with any new regulation, Reg BI has had its detractors. Public interest groups, including the Consumer Federation of America, the Financial Planning Coalition, and others, believe the SEC did not go far enough in raising the standards for Brokers. These groups urged the SEC to create for Brokers a fiduciary duty similar to the fiduciary duty that applies to Investment Advisors. Applying the fiduciary standard to Brokers, however, is fraught with insurmountable challenges.  For one, the broker-dealer model is based on commission compensation, the sale of proprietary products, and conducting principal trades (i.e., trading from the Brokerage Firm’s own account). Reg BI addresses such inherent conflicts by requiring that they be disclosed to investors.

Additionally, the Attorneys General in seven states and the District of Columbia have filed a lawsuit against the SEC in federal court in an effort to block implementation of Reg BI. These state, and D.C. argue that in issuing Reg BI the SEC exceeded its authority under the Administrative Procedure Act by failing to follow the mandate of the Dodd-Frank Wall Street Reform and Consumer Protection Act, which authorized the SEC to conduct rulemaking that would harmonize the standard of conduct between Brokers and Investment Advisors. In their lawsuit, the states and D.C. contend that Reg BI undermines investor protections provided by the Advisers Act and increases investor confusion over the standards of conduct that apply when an investor receives an investment recommendation from a Broker versus a recommendation from an Investment Advisor.

For its part, the Securities Industry and Financial Markets Association (SIFMA), which represents the broker-dealer, banking, and asset management industry, believes that the obligation under Reg BI to eliminate or mitigate conflicts of interest provides even greater protections for investors than is required under the fiduciary standard that applies to Investment Advisors.

While proponents and opponents of Reg BI are deeply divided over whether Reg BI will enhance or diminish protections for investors, where these two sides agree is that investors have been confused over the different standards of care that apply to Brokers and Investment Advisors when providing recommendations to investors. Will Reg BI clear up this confusion? Unfortunately, the adoption by the SEC of this new standard (best interest), which essentially builds on the current standard (suitability), will likely continue to cause confusion for of investors trying to understand how it differs from the fiduciary standard that applies to Investment Advisors.

Where Reg BI and the Advisers Act share something in common, it is that they were each created using a principles-based approach to regulation. Therefore, the determination whether a Brokerage Firm or a Broker has violated Reg BI will require the same analysis in determining whether an Investment Advisor has violated the Advisers Act — an analysis of the facts and circumstances of the alleged violation. As with any new regulation, the challenge that Regulation Best Interest presents for Brokerage Firms and Investment Advisory Firms (with respect to Form CRS) will be in drafting policies and procedures to comply with this new regulation.    

References:

1  See SEC v. Capital Gains Research Bureau, Inc., 375 U.S. 180 (1963).