

Michaël Dewally, Ph.D.
Associate Professor, Department of Finance, Towson University
Yingying Shao, Ph.D., CFA
Associate Professor, Department of Finance, Towson University
In the 2014 Baltimore Business Review, we noted a decline in FDIC-insured commercial banks in Maryland. The numbers had fallen from 106 in 1989 to 45 in 2013. At last count, this number stands at 35¹. Meanwhile, in the most recent Annual Report of the Maryland Department of Labor, Licensing and Regulation for the period ending June 2016, the number of state-chartered banks is down to 41². The recent trend stems from 10 mergers in the past three years. Robert DeAlmeida, CEO of Hamilton Bank, cited “low interest rates, increased regulatory demands after the recession and pressure from shareholders” as reasons for the tough times for the banking community.³
As early as 2012, representatives for The American Bankers Association pegged the annual compliance costs for the industry at $50 billion or 12 percent of total operating expenses. ⁴ The recent enactment of the Dodd-Frank Act added to the regulatory pressures exerted on all banks but more critically on smaller banks, whose compliance cost as a share of operating expenses is two-and-half times greater than for large banks. Joe Rizzi, a banking industry consultant, finds that banks felt the effects more acutely in this most recent period of increased regulation as “low interest rates and higher capital requirements combined to cut deep into bank profits.”⁵ Kathleen Murphy, President and CEO of the Maryland Bankers Association, reports that “one of the major reasons cited when a bank says they’re going to have to align with another bank, it’s because of the crush of regulations.”⁶ The costs of compliance range from having to hire additional personnel, additional training requirements for existing personnel, upgrades and acquisition of new software to diverted attention from the bank’s leadership.
Compliance Cost Measures
Whereas it is difficult for outsiders to measure the direct costs of regulatory compliance, Ken Cyree (2016)⁷ proposes six indirect measures to capture the extent of regulatory burden on banks. Table 1 presents Cyree’s suggested measures.
Using Pretax Return on Assets (ROA) is a good first order measure to study the impact of increased regulatory costs on a bank’s performance. Since ROA does not only depend on regulatory costs but also current market conditions, we will compare community banks’ (defined as banks with less than $1 billion in total assets) measures to non-community banks’. The baseline of this second group allows us to study if smaller banks bear a higher cost of implementation of new regulations.
Loans per employee is a measure of productivity. If regulatory compliance takes more employee time than before, productivity should suffer. Moreover, insofar as banks need to hire new compliance employees, Loans per employee would also decline. This leads to the next measure of Employee Growth, expected to increase as a response to the increased regulatory burden. If instead of adding compliance employees a bank simply shifts its workforce towards higher paid specialized compliance employees, higher Average Salary and Salaries to Assets measures would still capture the effect.
Finally, the impact of new regulation on technology expenses is ambiguous. If banks repurpose funds from technology improvement to cover new compliance costs, we would expect a decline in technology expenses following the implementation of new rules. Conversely, technological solutions might spur spending to meet the new compliance requirements. In either case, the regulatory environment does influence technology spending decisions.
Historical Perspective
While the Dodd-Frank Act’s 2,300 pages and more than 400 new rules and mandates are at the forefront of today’s bankers’ concern, the industry has experienced in the past the introduction of other regulation reforms. Cyree (2016) focuses on two other introductions to compare the intensity of Dodd-Frank’s effect in the current period. Correspondingly, we compare the new regulation to the Federal Deposit Insurance Corporation Improvement Act (FDICIA) of 1991 and the Uniting and Strengthening America by Providing Appropriate Tools Required to Intercept and Obstruct Terrorism Act (USA PATRIOT) of 2001. In each instance, we use a window of 18 quarters to highlight the immediate effect of the new regulation on banks’ measures.
The Evidence in Maryland
In the following set of charts, we present the time series of all the six measures from 1991 to the most current period with available data. In grey, we highlight the periods during which the banking community adjusts to the three new regulatory environments highlighted above. In Figure 1, we see that banks in Maryland experienced a long stable period of profitability that ended with the Great Recession. From the depth of the crisis, profitability has steadily risen though it remains inferior to the pre-crisis period. While community banks experienced a strong recovery in their profitability, their performance lags that of non-community banks more than before the crisis. This is the first evidence that regulatory costs may exert greater pressure on smaller institutions.
Figure 1: Historical Series of Pretax ROA
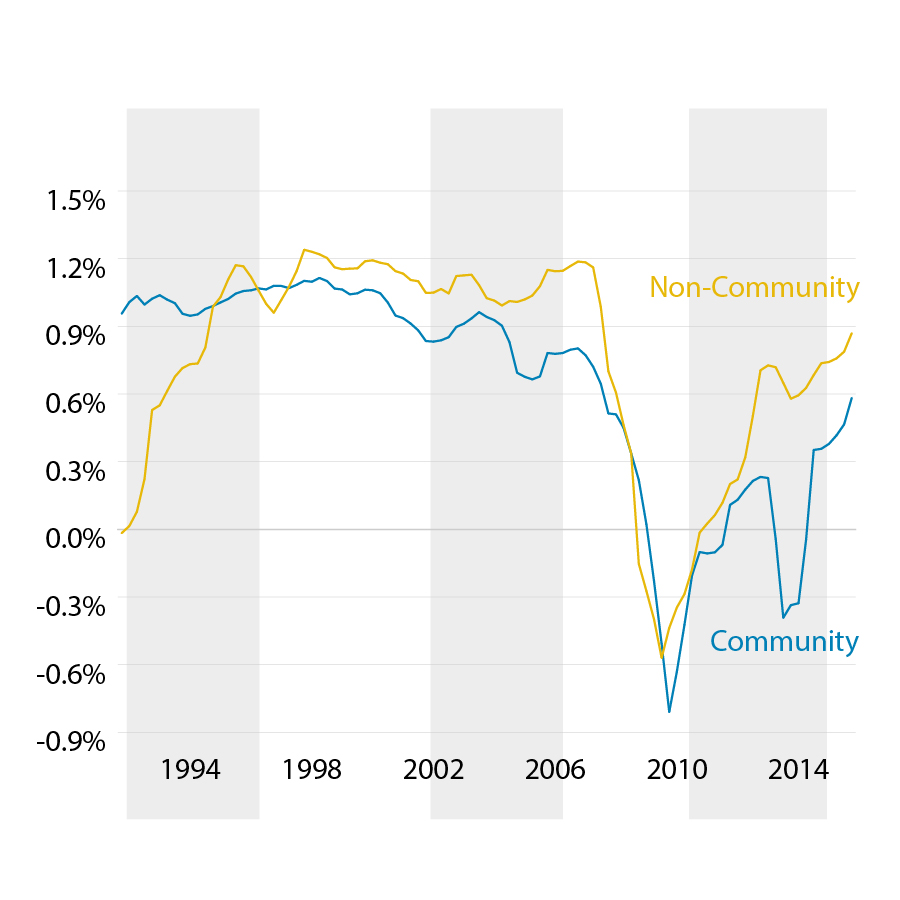
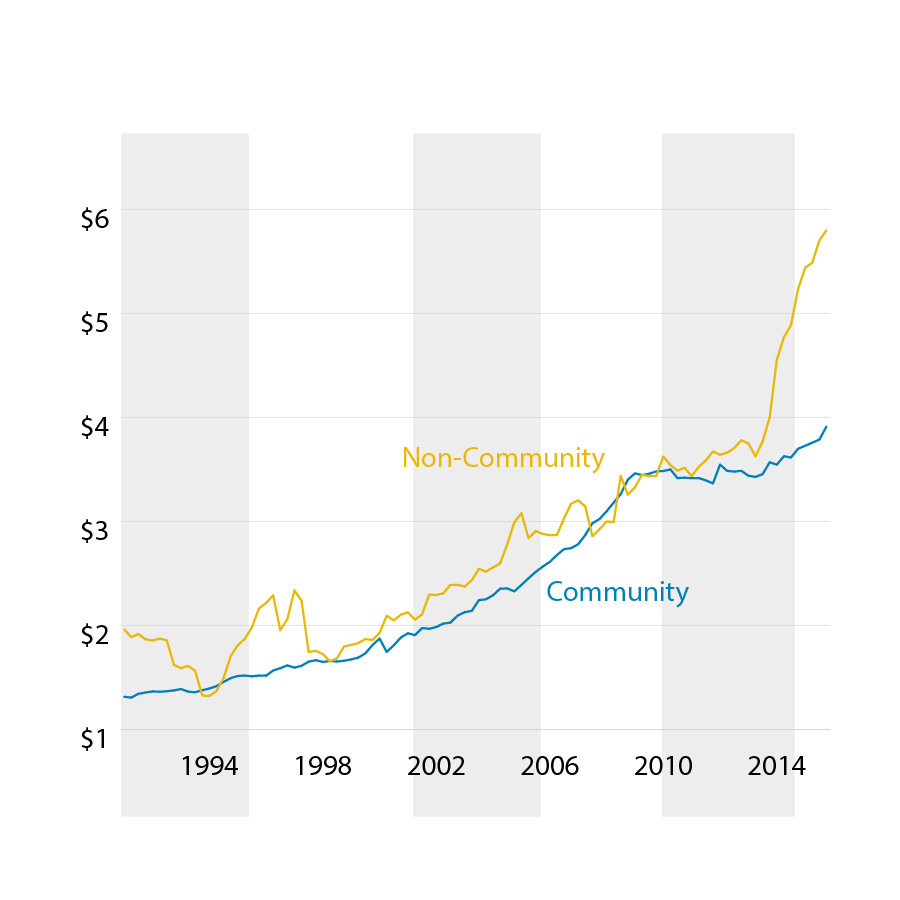
Figure 2 reveals that banks’ productivity has been on an upward swing since the early 1990’s. While an employee generated $2 million in loans in 1991, an employee in 2014 generates more than twice that amount. This stems from a combination of ever-increasing credit availability and improvement in credit-scoring technology. Whereas the trends for community and non-community banks aligned for most of the period, community banks are currently not able to match the recent improvement of non-community banks. For the first time in 20 years, community banks’ employees generate significantly fewer loans than their non-community banks counterparts do. If fewer employees are involved in profit center activities (lending) and more employee time is dedicated to cost center activities (compliance), this can explain the difference in profitability as seen in Figure 1.
Figure 2: Historical Series of Loans per Employee
In all three new regulation periods, we observe a spike in employee growth. This is particularly sharp for the FDICIA and the USA PATRIOT periods. While the spike in Employee Growth is less pronounced for the Dodd-Frank period, there is a clear increase in Average Salary. Taken in combination, it appears that banks have been substituting compliance positions for lending positions.
Figures 3 and 4 compare Employee Growth and Average Salary for the two groups. Employee Growth has been steady over the past 20 years. On average, banks today have 2.5 employees for each one they had in 1991. This results from the increase in the industry’s complexity with the multiplication of products and services and the continued trend of consolidation whereby we have fewer but larger banks.
Figure 3: Historical Series of Employee Growth

Figure 4: Historical Series of Average Salary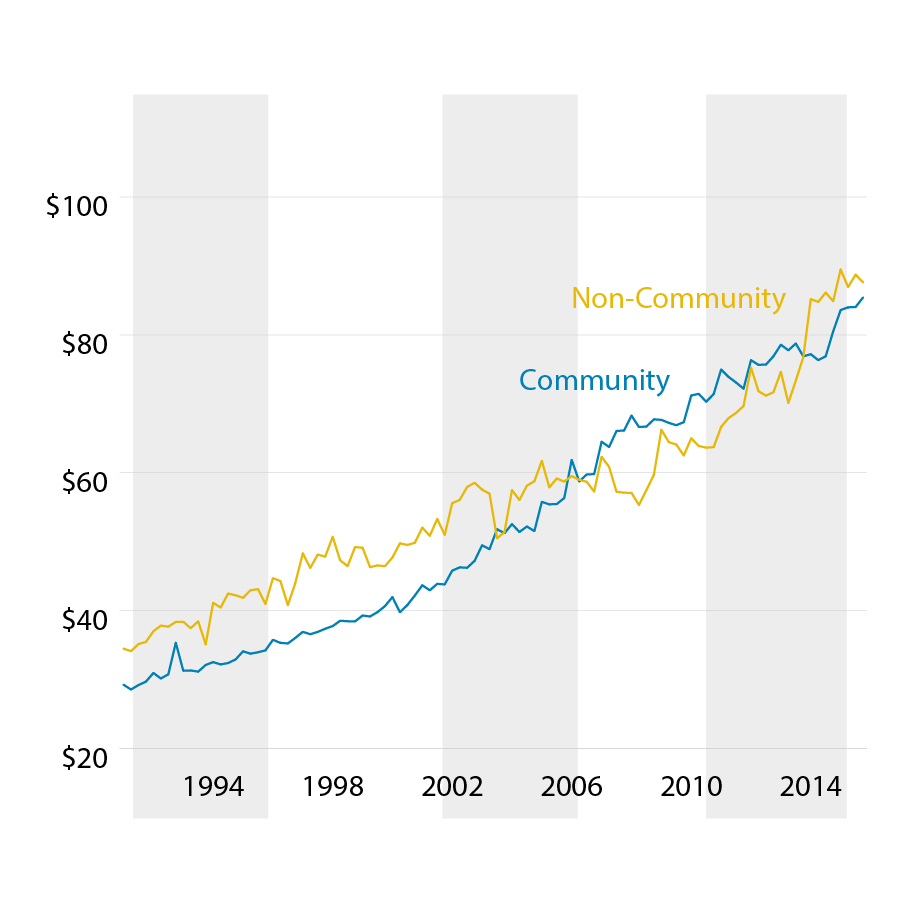
Figure 5 sheds further light on this trend and presents the history of Salaries to Assets. Here, the costs of accumulated new regulations are particularly striking for community banks. Up until 2003, both community and non-community banks dedicated slightly over one and a half percent of assets for salaries. Today, while non-community banks spend less than in 2003, community banks pay upwards of 2.5% of assets in salaries. This agrees with the idea of a changing composition of the workforce with higher skilled and higher paid compliance and technological employees accounting for a higher proportion of banks’ personnel.
Figure 5: Historical Series of Salaries to Assets

Finally, Figure 6 shows that since the introduction of the Dodd-Frank Act, both community and non-community banks have dedicated a lower percentage of assets to expenditures, including for technological assets. This represents a missed opportunity for banks. Under a constrained budget, with more resources shifting to answer the new regulatory demands, banks are under-investing in their technological future. This is a risk at a time they face increasing competition from non-traditional lenders that tend to rely on technological advances to connect with potential clients, to manage their lending risks and their overall costs. Any diversion from remaining competitive on this front will hurt the future profitability of the more heavily regulated institutions.
Figure 6: Historical Series of Expenditures to Assets

Conclusion
On balance, our investigation uncovers some noticeable changes in banks’ behavior following the implementation of the Dodd-Frank Act. Smaller community banks in Maryland are: 1) not recovering profitability as fast as non-community banks, 2) not increasing productivity as fast as non-community banks, 3) dedicating more employees and a higher budget to compliance functions and 4) not investing into technology as they have in the past. A picture of impaired competitiveness emerges, reflected in the sector’s stock performance lagging the overall market’s post-crisis recovery prior to the recent election bank rally. In light of these facts, the industry is looking at continued consolidation to remain competitive which would continue to decrease its presence in the Maryland marketplace. While pre-crisis in 2008 Maryland State Chartered banks accounted for 43% of all bank branches in Maryland, they recently only represented 30% (500 out of 1,679 in 2015) of all branches. In this environment, the industry is looking with anticipation at potential changes in the regulation. In particular, the Financial CHOICE Act aims to amend some of the rules enacted under Dodd-Frank. Kathleen Murphy stated, “the Choice Act, while not perfect from our perspective because it sets certain reserve requirements that we don’t completely support, contains components that we support, particularly for community banks.”
References:
1 http://www2.fdic.gov/hsob
2 https://www.dllr.state.md.us/finance/finregannrep2016.pdf
3 The number of community banks in Maryland is shrinking, by Carrie Wells, The Baltimore Sun, October 16, 2015.
4 Compliance costs crushing community banks, by Ted Carter, Mississippi Business Journal, May 10, 2012.
5 Smaller banks eye way forward, by Chris Fleisher, Pittsburgh Tribune Review, June 4, 2014.
6 Md. banks keep an eye on potential Dodd-Frank changes, by Tim Curtis, The Daily Record (Baltimore, MD), June 18, 2017.
7 Ken Cyree, 2016, The Effects of Regulatory Compliance for Small Banks around Crisis-Based Regulation, The Journal of Financial Research, 39 (3), 215-245.