

Silas Hoxie
Portfolio Manager, Towson University Investment Group
Regis Breen
President, Towson University Investment Group
During the Fall semester of 2016, the Towson University Investment Group (TUIG) surveyed 200 students on campus, posing the question “If you had $100,000 to invest, and could choose five companies to invest in, which five would you choose?”
We then created a $100,000 hypothetical portfolio comprised of the top 30 responses, which amounted to a total of 986 votes. The weight of each holding was determined via the number of votes each holding received. For example, Twitter received 82 of the total 986 votes, consequently amounting to 8.32% of the total portfolio.
The goal of the survey is to collect sample data from the student body of Towson University to evaluate whether an average Towson student is able to beat the market. Once the data is consolidated, we are able to compare the TU Survey Portfolio to the performance of the S&P 500 Index.
The TU Survey Portfolio companies were purchased at their 10/31/2016 closing prices, which is also the portfolio’s inception date. In the Fall of 2017, the TUIG conducted another survey and reallocated the portfolio’s ending value on 10/31/2017 according to the new survey results. This method allows us to compare the performance of the TU Survey Portfolio to the market over several years.
Major Holdings
The top five most frequently selected companies in 2017 account for a staggering 44.4% of the portfolio’s allocation. The top five most allocated holdings are as follows: Amazon.com, Inc. (AMZN) 11.9%, Apple Inc. (APPL) 10.1%, Alphabet Inc. (GOOG) 8.8%, Microsoft Corp (MSFT) 7.7%, and Under Armour Inc. (UAA) 6.0%. Several of these holdings are currently leading performers in their respective sectors. Amazon is widely considered as one of the most powerful online retail giants in the consumer cyclical sector at the moment. The same can be said for technology vanguards Microsoft, Apple, and Alphabet. We believe that Under Armour was favored due to its relationship with Towson University as the sponsor for athletic wear on campus, in addition to the CEO’s nearby roots as an alumnus of the University of Maryland.
Only two major holdings from the 2016 survey results managed to make this year’s top five holdings. In the 2016 survey the top five holdings made up 33.9% of the portfolio, including Twitter Inc. (8.3%), Under Armour Inc. (6.7%), Apple Inc. (6.4%), Yahoo (6.3%), and Facebook, Inc. (6.2%).
Sector Allocation
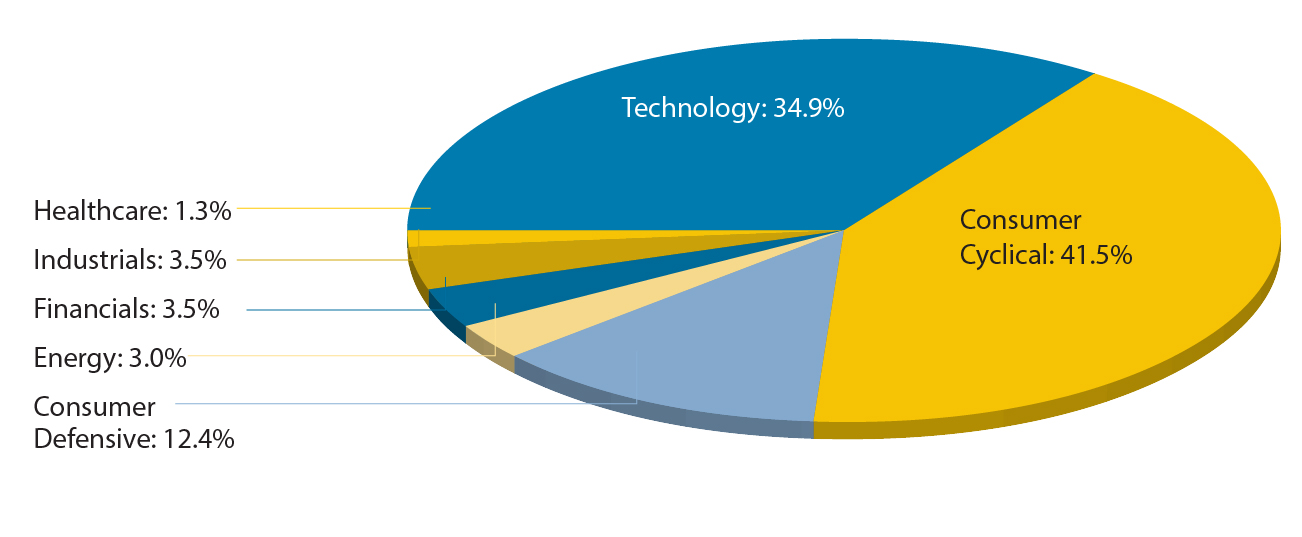
Table 1 presents the 2017 sector allocation and their respective weights: Consumer Cyclical (41.5%), Technology (34.9%), Consumer Defensive (12.4%), Financials (3.5%), Industrials (3.5%), Energy (3.0%), and Healthcare (1.3%). A remarkable 76.4% of the portfolio is allocated towards the Consumer Cyclical and Technology sectors.
Table 1: Sector Allocation
| 2016 ALLOCATIONS | ||
| Sector | Count | % |
| Technology | 504 | 51.1% |
| Consumer Cyclical | 332 | 33.7% |
| Consumer Defensive | 54 | 5.5% |
| Energy | 4 | 0.4% |
| Utilities | 0 | 0.0% |
| Communications | 66 | 6.7% |
| Real Estate | 0 | 0.0% |
| Financials | 4 | 0.4% |
| Basic Materials | 0 | 0.0% |
| Industrials | 22 | 2.2% |
| Healthcare | 0 | 0.0% |
| Total: | 986 | 100.00% |
| 2017 ALLOCATIONS | ||
| Sector | Count | % |
| Technology | 332 | 34.9% |
| Consumer Cyclical | 395 | 41.5% |
| Consumer Defensive | 118 | 12.4% |
| Energy | 29 | 3.0% |
| Utilities | 0 | 0.0% |
| Communications | 0 | 0.0% |
| Real Estate | 0 | 0.0% |
| Financials | 33 | 3.5% |
| Basic Materials | 0 | 0.0% |
| Industrials | 33 | 3.5% |
| Healthcare | 12 | 1.3% |
| Total | 952 | 100% |
|
10/31/16 |
TU Survey Portfolio $10,000.00 |
S&P 500 $10,000.00 |
| 10/31/17 | $11,516.81 | $12,112.32 |
Figure 2 presents the 2016 sector allocation and their respective weights: Technology (51.1%), Consumer Cyclical (33.8%), Communications (6.7%), Consumer Defensive (5.5%), Industrials (2.2%), Financials (0.4%), and Energy (0.4%).
Figure 1. 2016 Sector Allocation of TU Survey Portfolio
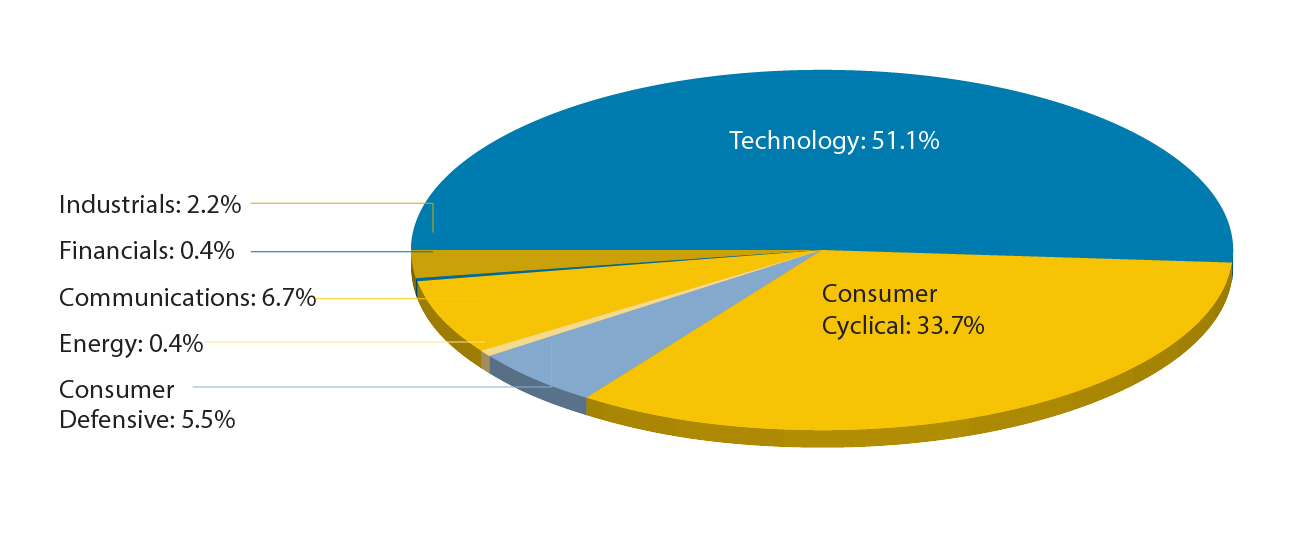
Figure 2. 2017 Sector Allocation of TU Survey Portfolio
Observations
There is no question that the survey results from this year do not reflect the same holdings from the survey results of 2016. For instance, in this year’s survey students chose several companies that did not receive a single vote last year, including Adobe Systems Inc. (ADBE), Tesla Inc. (TSLA), and Canopy Growth Corp. (WEED). These votes most likely resulted from increases in media presence.
Adobe recently partnered with Microsoft in order to exploit its cloud-based storage capabilities. As our society becomes increasingly more data-oriented, it comes as no surprise that students voted for one of the most suitable providers of data storage from emerging artists to global brands.
As for Tesla, CEO Elon Musk is known for his innovative nature, making headline news on a bi-weekly basis. The most recent of his endeavors was an announcement regarding the construction of hyperloop from Washington, D.C. to New York City. Musk claims that the one-way commute time is estimated under 30 minutes. Elon Musk’s Tesla received a total of 32 votes. Musk’s flamboyant reputation, know-how, and valuable mission aimed at building the future each day has clearly captured the attention of students at Towson University.
Last but certainly not least, Canopy Growth Corp., received five total votes. Canopy Growth Corp. is headquartered in Smiths Falls, Canada. Canopy has seen promising growth this year, as a result of the announcements from the Canadian government aimed at loosening regulations on the marijuana industry. With 11 marijuana dispensaries poised to open in nearby Baltimore City, it certainly is possible that Towson University students might be catching wind of a promising new industry on the horizon.
One of the most reputable investors of all time famously advised individuals “never to invest in a business you don’t fully understand.” Warren Buffet is seldom wrong, even to this day. On another note, Peter Lynch so eloquently said; “never invest in an idea you can’t illustrate with a crayon.” The survey results from this year suggest that students took-to this sort of advice. The top 10 companies from this year’s survey account for 66.70% of the portfolio. One thing that these companies all have in common, is that each produces a product or service commonly found on most college campuses. These products include Apple’s iPhone, Microsoft’s Xbox One or Office Program Package, or Under Armour’s apparel.
For most college students, the idea of risking a paycheck to make an investment in a market that they don’t truly understand just isn’t worth it. It comes as no surprise that companies which advertise specialty products and services to college campuses carry the most weight in the portfolio. The survey results suggest that students are more likely to invest in companies that provide the products and services they understand.
Performance
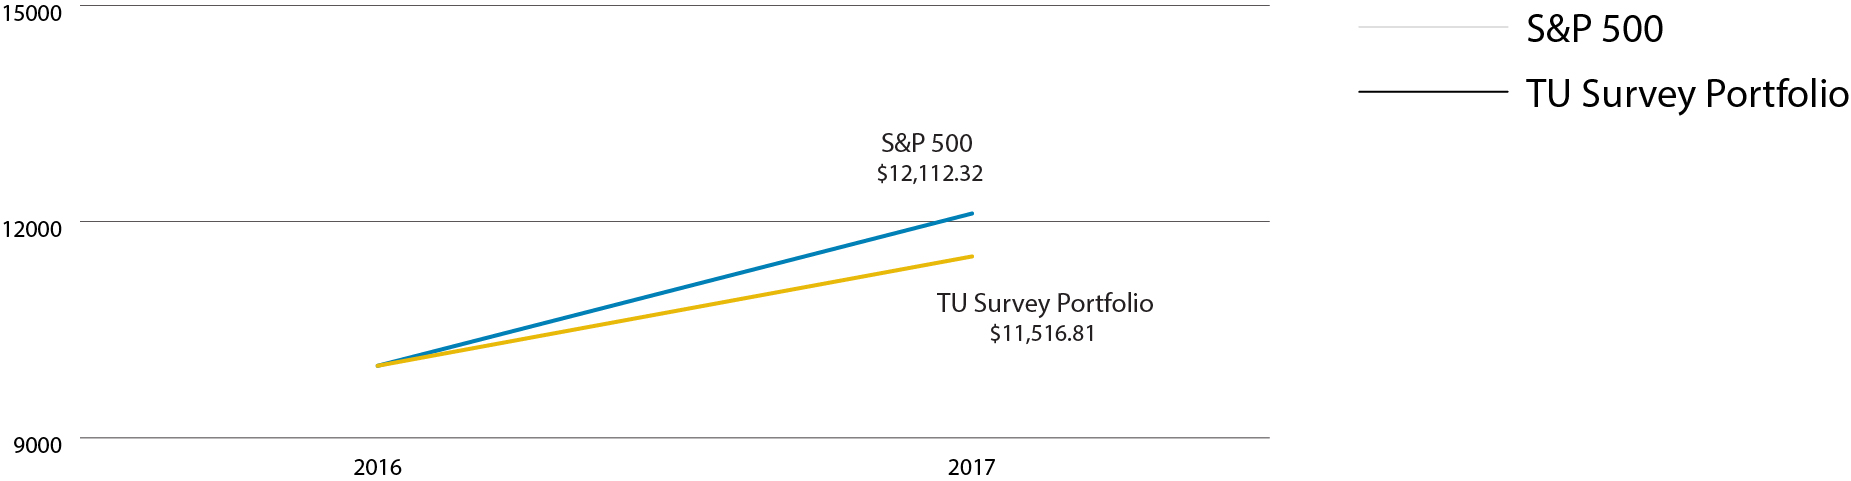
Figure 3 presents the one-year hypothetical growth of $10,000 invested in the S&P 500 Index, and the 2016 TU Survey Portfolio from October 2016 to October 2017. As we can see, the TU Survey Portfolio underperformed the S&P 500 Index. The lagging performance of the portfolio can be attributed to a couple key factors. First, Under Armour -one of the top five holdings of the portfolio- declined 61%, attributing over $4,000 in investment losses. In addition, Macy’s, Comcast, and Chipotle all declined 25%-48%, resulting in a combined $3,100 investment loss. These heavily-allocated losers overshadowed stellar performances of lower-allocated holdings such as Bank of America (+67%), Netflix (+59%), and Southwest Airlines (+35%).
Figure 3: 2016 Growth of $10,000
As we reallocate the portfolio to the 2017 survey results, there are a few important components to make note of. First, the diversification of the portfolio has slightly increased. The combined allocation of the Consumer Cyclical and Technology sectors decreased from 85% of the portfolio in 2016 to 76% in 2017. This money was reallocated into the Financials, Healthcare, Energy, and Consumer Defensive sectors. While the portfolio is still extremely overweight in the Consumer Cyclical and Technology sectors, the slight expansion into other sectors will allow the portfolio to benefit more from different tides in the market. Second, the students are now most allocated into the Consumer Cyclical sector rather than Technology like the year before. It’s possible that we are seeing a change in millennial mindsets for investment strategies. Finally, Under Armour was the biggest loser for the 2016 portfolio, yet has an even higher allocation in 2017. Could the students have bought more into the company while it’s undervalued, or are they headed for another disappointing loss?
Towson University Investment Group
The Towson University Index (TUI) was created in 2007 to measure the performance of publicly traded companies that had a connection to Towson students. The index is meant to serve as a sample of companies who have a history of hiring Towson University students, are thought to be possible hirers of Towson students, or have some other connection to the University or the state of Maryland. The current TUI is composed of 50 publicly traded companies with 31 Maryland and 19 non-Maryland companies. In designing the index, we used a weighted approach where companies with larger market capitalizations hold a greater representation than their smaller counterparts.
Disclosure:
The current TUI is based on the 2015 TUI and was updated with the assistance of Towson University’s Internship and Career Services program. Historical company prices were obtained from Yahoo Finance, employee figures were obtained from MSN Money, sectors of the companies and their respective quarterly revenues were obtained from NetAdvantage, a Standard and Poor’s service. August 29, 2015 market capitalizations where obtained by dividing recent company market capitalizations by recent company prices and multiplying this number by the share price on August 29, 2015. This calculation assumes the effects of changes due to share insurances to be minimal.